I need all kind of semi static data for calculations, like one table with only these kind of records:
exchange rates
averages of salaries
working days per month
etc
So what I am looking for is like a table with all these calculation results, like summations, averages (from existing tables in the application) , but also changing data (like updated standard data through an edit form), data automatically updated from external sources, etc…
Goal is to make a forecast application, very like doing what excel does and use all kind of data to add, subtract, multiply and divide.
What you have described in entirely possible using complex formula fields. These are as not as flexible as an excel spreadsheet, but are still very capable.
@mtif Martin - I think I have to be more clear.
I will set-up something in Excel to show what I mean. The calculations is not the point here. it is how to organize and use data. I will come back with some additional explanations.
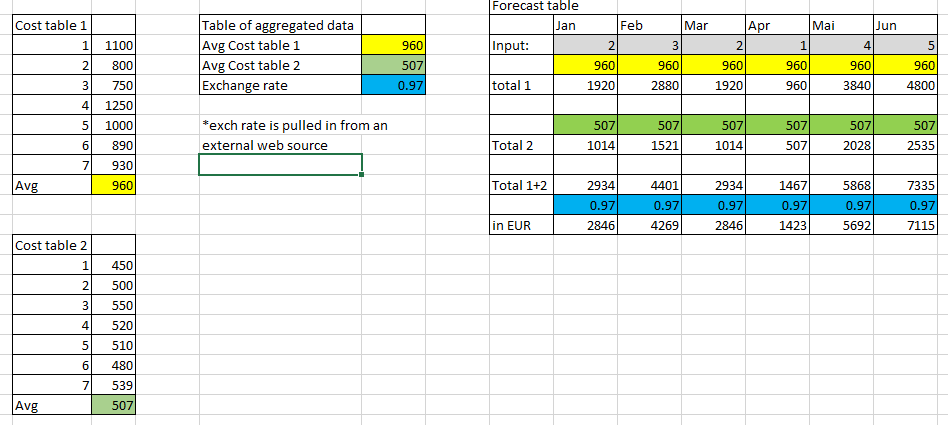
We have two tables in the tadabase structure. From this I take averages which I would like to put in a aggregated data table (to keep things tidy).
In this aggregated datatable I also have a link to outside source where I pull in a actual exchange rate, this is automated and overwrites the data in the aggregated data table daily (through automations):
This aggregated data is pulled in into a data table for forecasts. I have a form with inputs per month (for example number of products we are going to buy), and with the formula field we calculate the forecasted costs.
In excel this is so easy, but I would like to do something alike in Tadabase, even if it is complicated.
I am looking for the method how to do this here and how to set-up the data structure within Tadabase, so the generic picture.
On the face of it this seems relatively straightforward.
I am not sure of the sources of your data for Cost table 1 & 2, but assume you have that automation solved. These can update as often as you wish.
I would not separate out the Aggregated table as a separate table, and would put both aggregated and forecast into a single database table in tadabase for two reasons
The tidyness issue is easy, you can display exactly as you have laid out with two versions of the combined data table on the display page (showing different columns). They will look like they come from different data tables, but don’t.
Both the aggregated table and forecast table need to work on rollup averages from the two cost tables, and there is no reason to calculate the rollup twice in two separate tables.
NB: complex formula calculations in Tadabase work on fields that are present (or duplicated into) the same table. So all your number fields that need to crunched will need to be the combined forecast table.
It just doesn’t work.
I can create a table for the exchange rate (with only 1 record). and with a connection and a lookup I can get this exchange rate into the forecast table and calculate with it.
But generating an avg is not possible, because your connection goes to the table with the values (in this case the different cost records), but is connected to one record only. So you only get the average of this 1 record, which is naturally also the value of this 1 record…
Yes, for the averages you will need to use a Rollup field (its an Equation type Field) and this can calculate a sum or average for the numeric values.
So I would create new fields in your calculations table for each of your Averages, or Sums of different tables. You can then use these in a complex calc to do you final calculations.
In my experience I have found that Tadabase tables get quite wide, as I have added extra fields to create, compute, compile, the data that feeds the ultimate complex calcs. But I have never (so far) hit performance hurdles.
No a rollup field doesn’t work, which I tried to explain in my previous post.
I think I will try make.com - maybe they can help me in getting the average. I think there is no native way in Tadabase to do that…
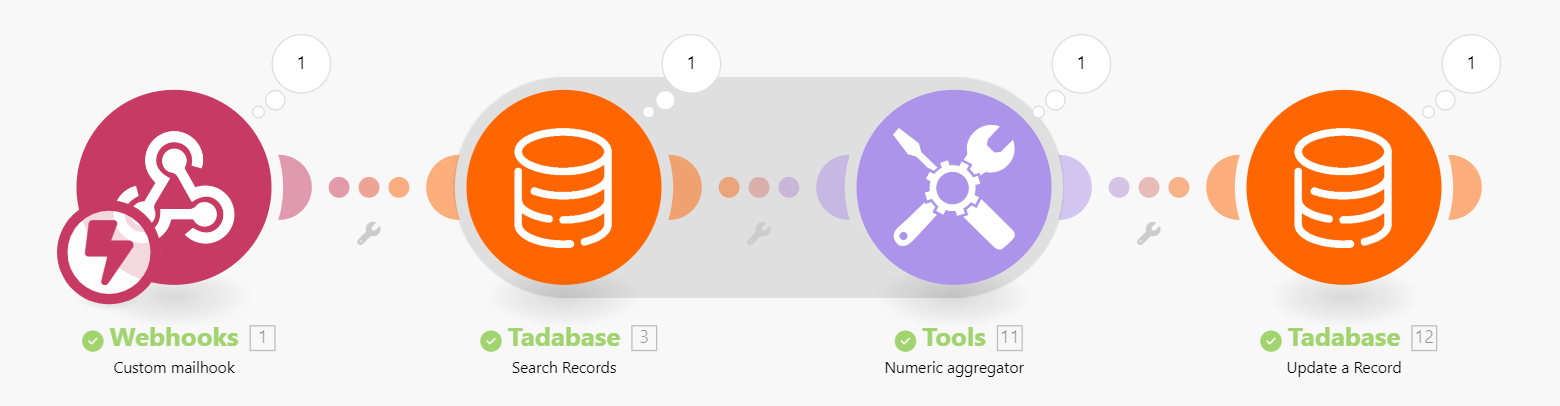
OK, some puzzling but I found a solution to get records from a table in Tadabase into make.com and then take an average from the records and save the average into a table with calculation variables which can then be used in a calculated forecast table.
I use Make a lot too, its a great way to go.
But, depending in the full spec, its also possible to build in Tadabase native,
Here’s my quick bash at it.
I just did this to show a possible approach, and to show that Rollup can work. I can concieve of other approaches which might be better suited to your exact purpose.
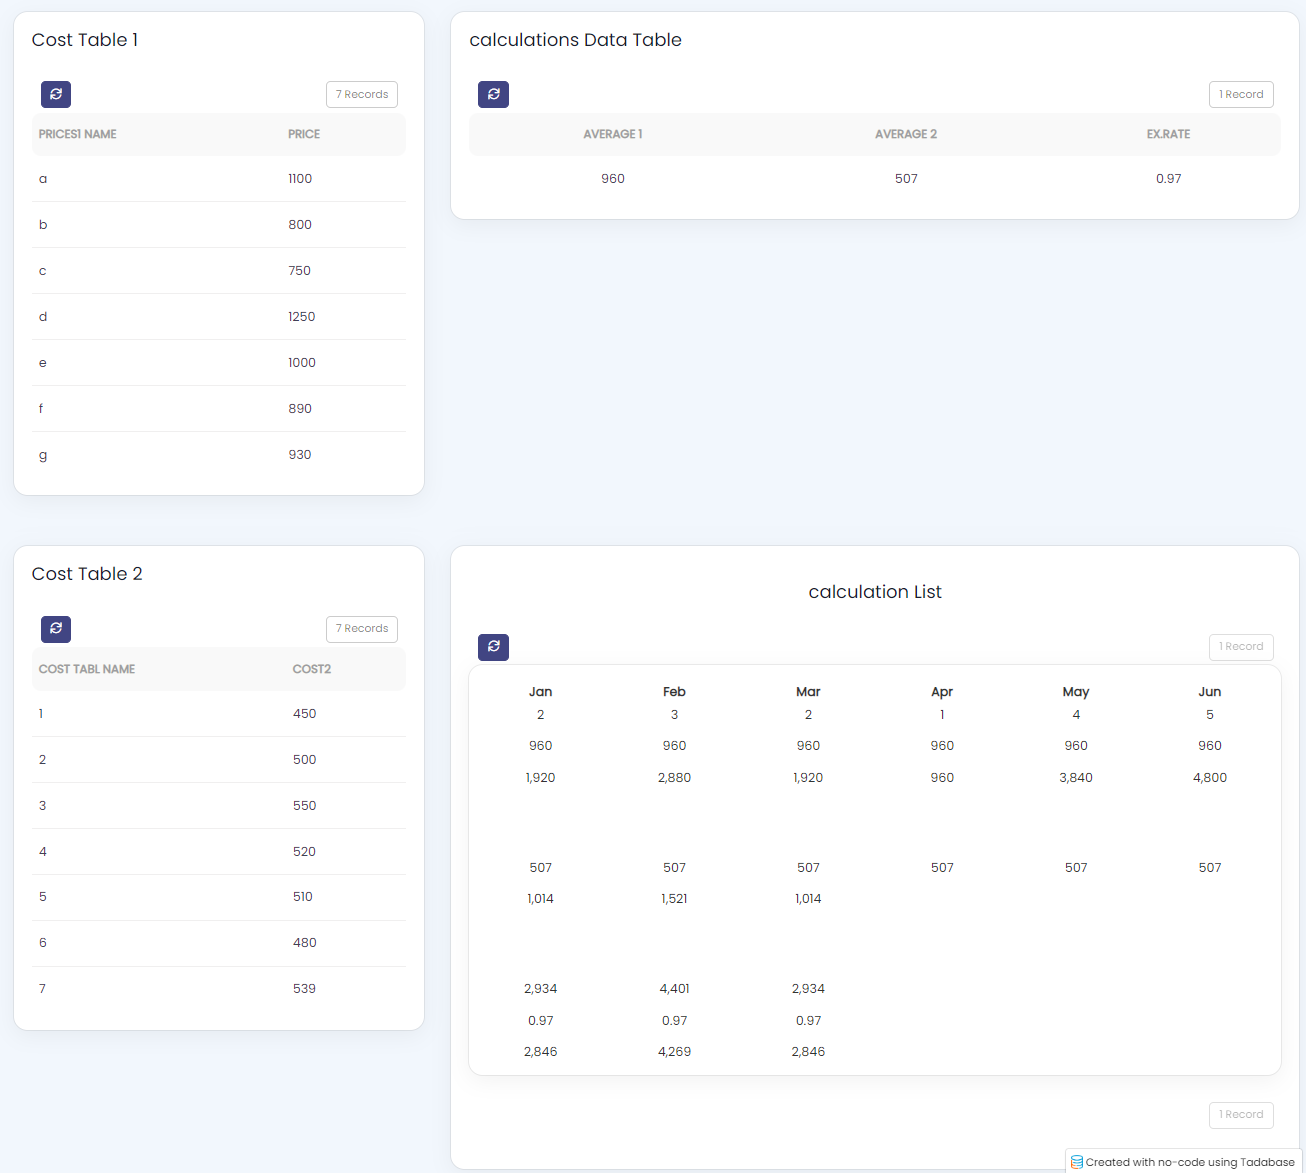
But, to make this example work. I have 3 tables - Cost Table 1, Cost Table 2 and Calculations.
The cost tables have rows which store the Cost Name, Cost and (crucially) a connection link to a record in Calculations table.
The Calculations table has multiple columns to accommodate ALL of the fields that appear in the Calculations Data Table and the Calculations List on the image.
In summary - the Calculations table has a single row (at present) and all of the Cost Table rows link to this row (thats why Rollup works).
This set up might work for you, as you could have more rows in this Calculations table that might represent different Clients/Times/Products or such like. If this is useful what you would need to do is connect the appropriate Rows in the Cost Tables to the correct row in the Calculations table to customise for the Client/Time/Product.
I hope that helps explain. But, I reitterate, this is only one approach, and there are others that which might suit your needs better. I just wanted to show how rollup can work.