Use Case: We have IT contractors who log in their hours for each day. (not “In” and “Out” – just the total hours they worked in the day).
The contractor should be able to select the Year and Month. The days in the month should be listed so that the contractor can enter the hours worked in each day.
March 2022 Timesheet
3/1/2022 Tuesday [Number Field]
3/2/2022 Wednesday [Number Field]
so forth
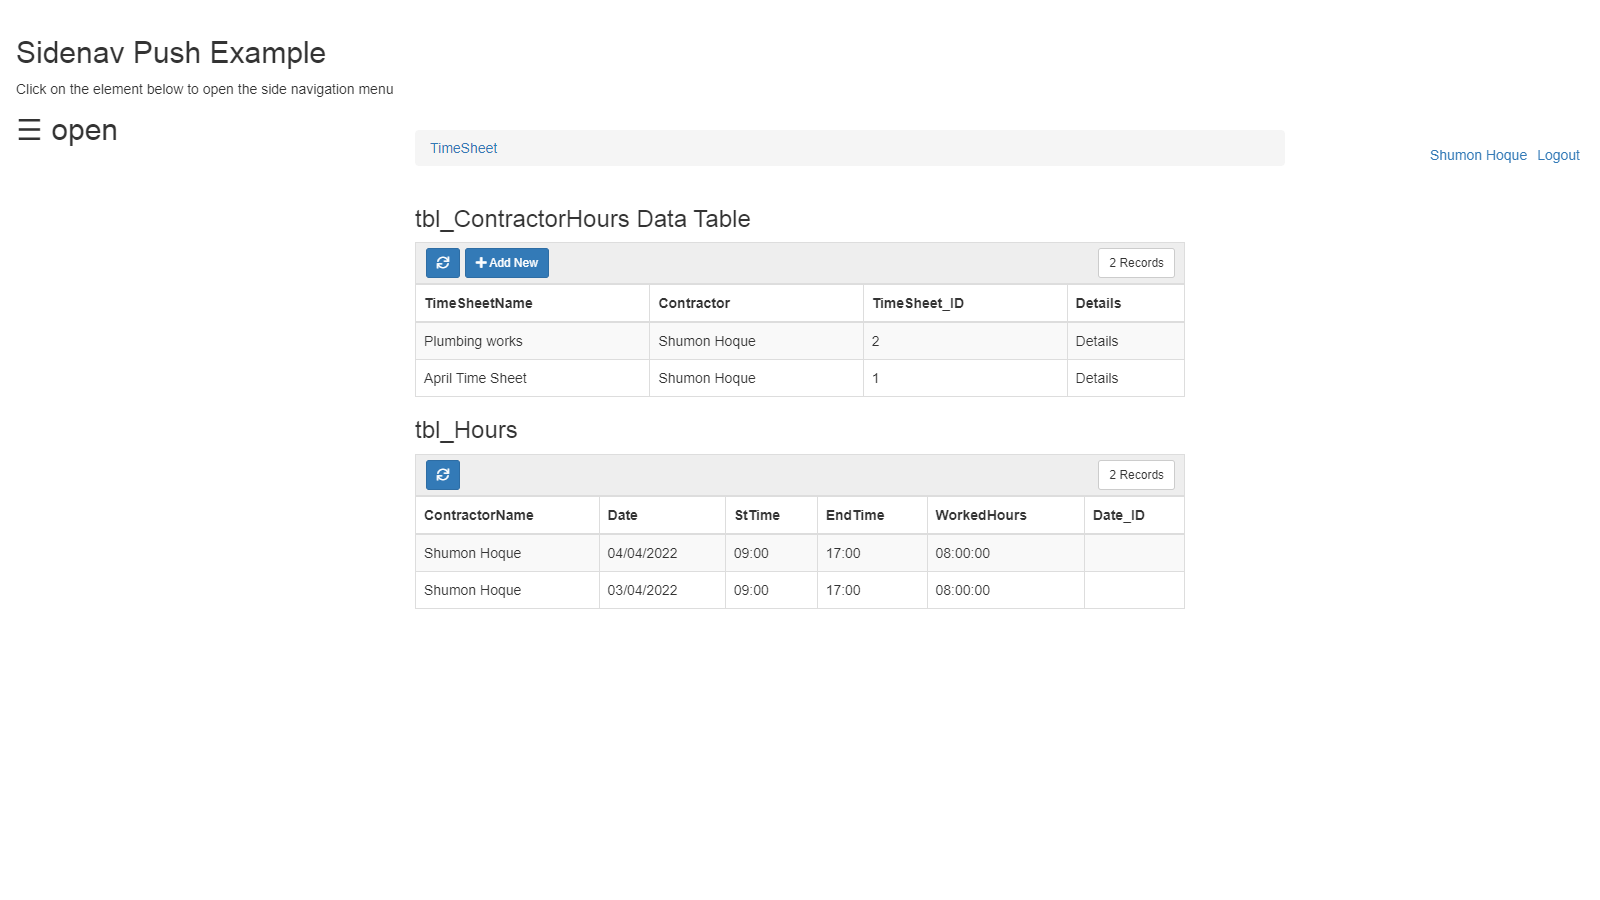
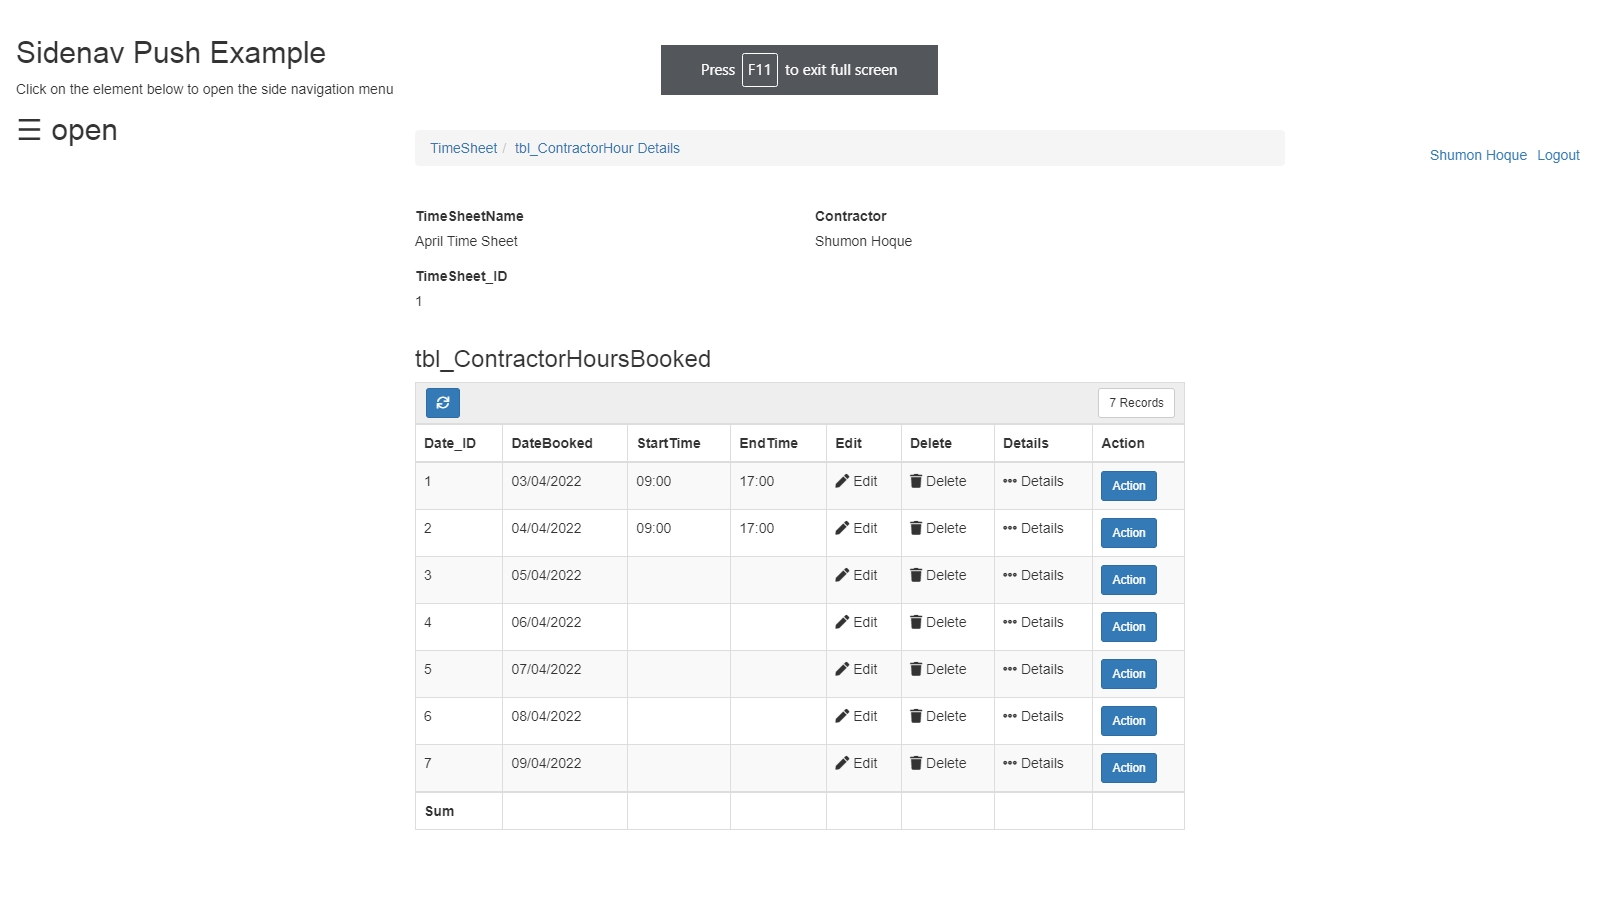
As a company User, we should be able to see the list of around 500 contractors’ hours of the month …
Column 1 - Name of Contractor
Column 2 - First Day of Month
Column 3 - Second Day of Month
so forth …
Question, what do I design the data table , (we can possibly use the “Resource Component” or Calendar Component to Display the data.
Everything is pretty straightforward I guess, when you can filter data based on logged-in user, so that contractor can only see its own entries.
Tricky is that you want the overview in monthly tables. My guess is that you then work with automations. So, every day you should sum up the day, for example at 2h am at night. With the automation, you will write the contractor, hours of this previous day, month-nr and day-nr into a new table. Which you can display as a monthly table for your overview.
This automation can also be done weekly, or monthly.
This only works when data is complete when the automation is done, though.
Hi Peter, we have around 500 active contractors. New contractors come and go every week but on an average we will have around 500 active contractors.
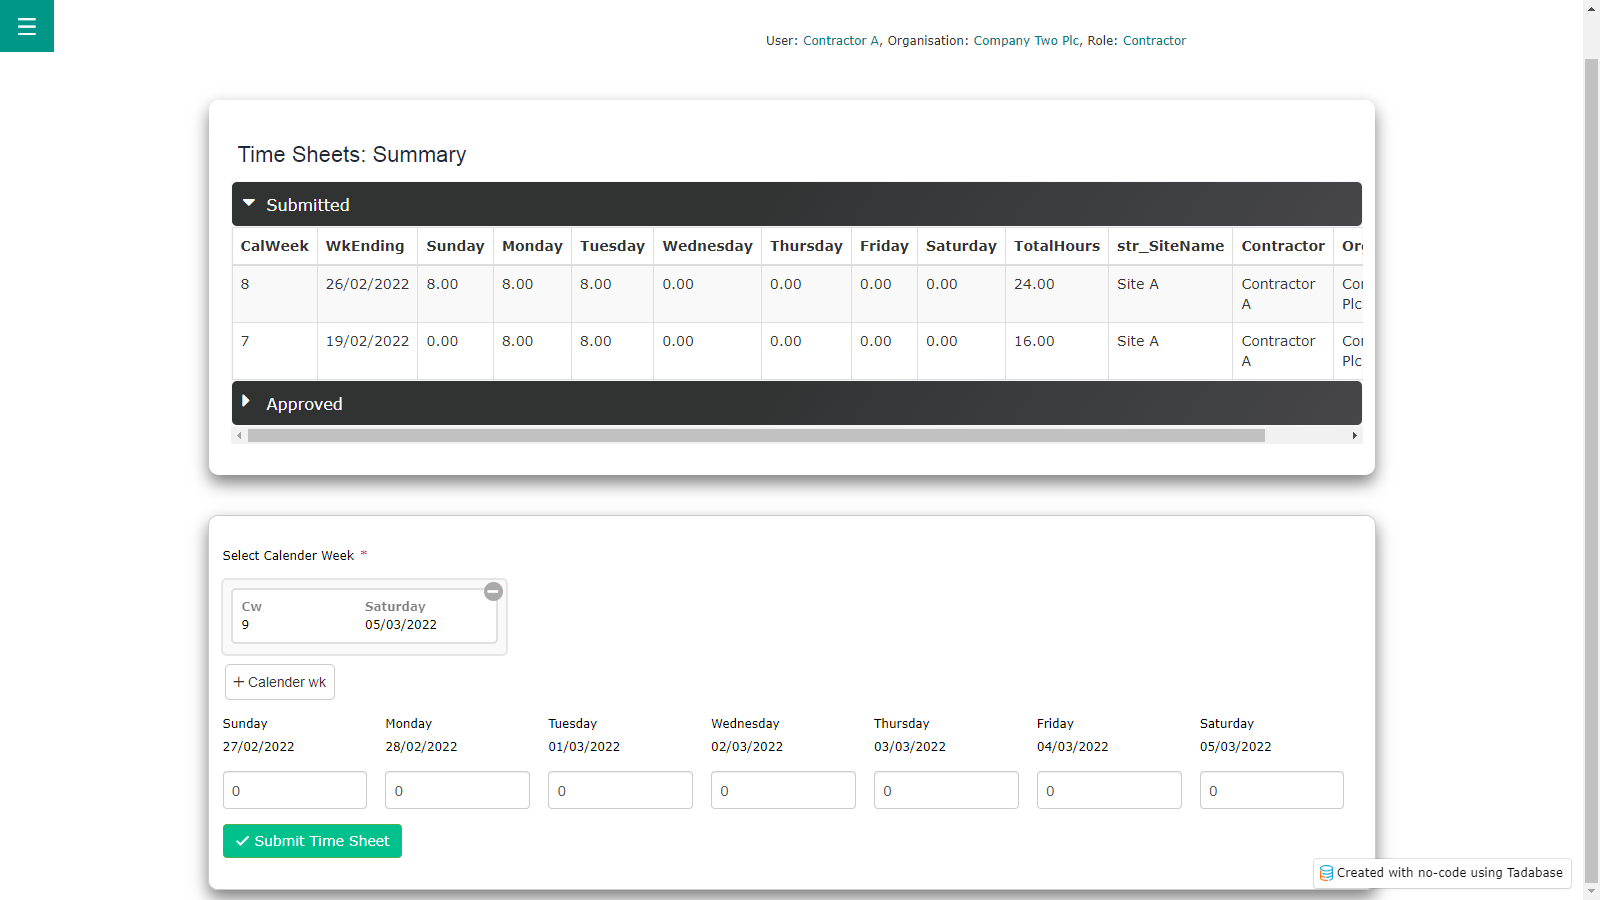
So basically, I want to have a weekly table beginning Sunday and ending on Saturday.
I am thinking of a datatable like below
Sunday Date
Sunday Hours
Monday Date
Monday Hours
…
Saturday Date
Saturday Hours
On Friday night of week 1
I want to create an automation task to create record for all active contractors for Week 2
Populate the Sunday Date with the date of the Week 2 Sunday, ie Sunday Date = 5/1/2022 Monday Date = 5/2/2022 Tuesday Date = 5/3/2022 …
Now in UI, the contractors will see date (non editable) and can add their hours in the hours fields i.e Sunday Hours, Monday Hours … Saturday Hours.
I want a weekly table … because timesheet table for every day will average to around 180,000 records. vs around weekly records of under 26,000 records.
table 1: users ( role is contractor, you can add rollup here too for total hours)
table 2: calender (blank table to hold dates with start time, end time, hrs worked )
table 3: History records archive. ( holds actual hrs worked against each date)
table 4: contractor summary timesheets. ( shows total hours worked per week)
you use the blank calender table to fill in the hours then use action button to append the data into table 3 which holds all the actual records. It works but of course lots of validation rules will be need to be added to avoid duplicate timesheets for same contractor, same date etc…also on exit the blank table will need to be cleared once the data has been submitted into archive table etc… screenshots below, i hope that helps you. I was up for a challenge so thought i’d have ago.
Two tables:
Parent table: Dates
Child Table: Weekly Hour records, including contractor
Each parent record has the Sunday date of that week.
Child table records have 7 fields - Sun-Mon…Sat to hold the hours, plus contractor’s name and a week-total field
You don’t need to generate a million records automatically - unless you want to generate the 52 parent records for the year?
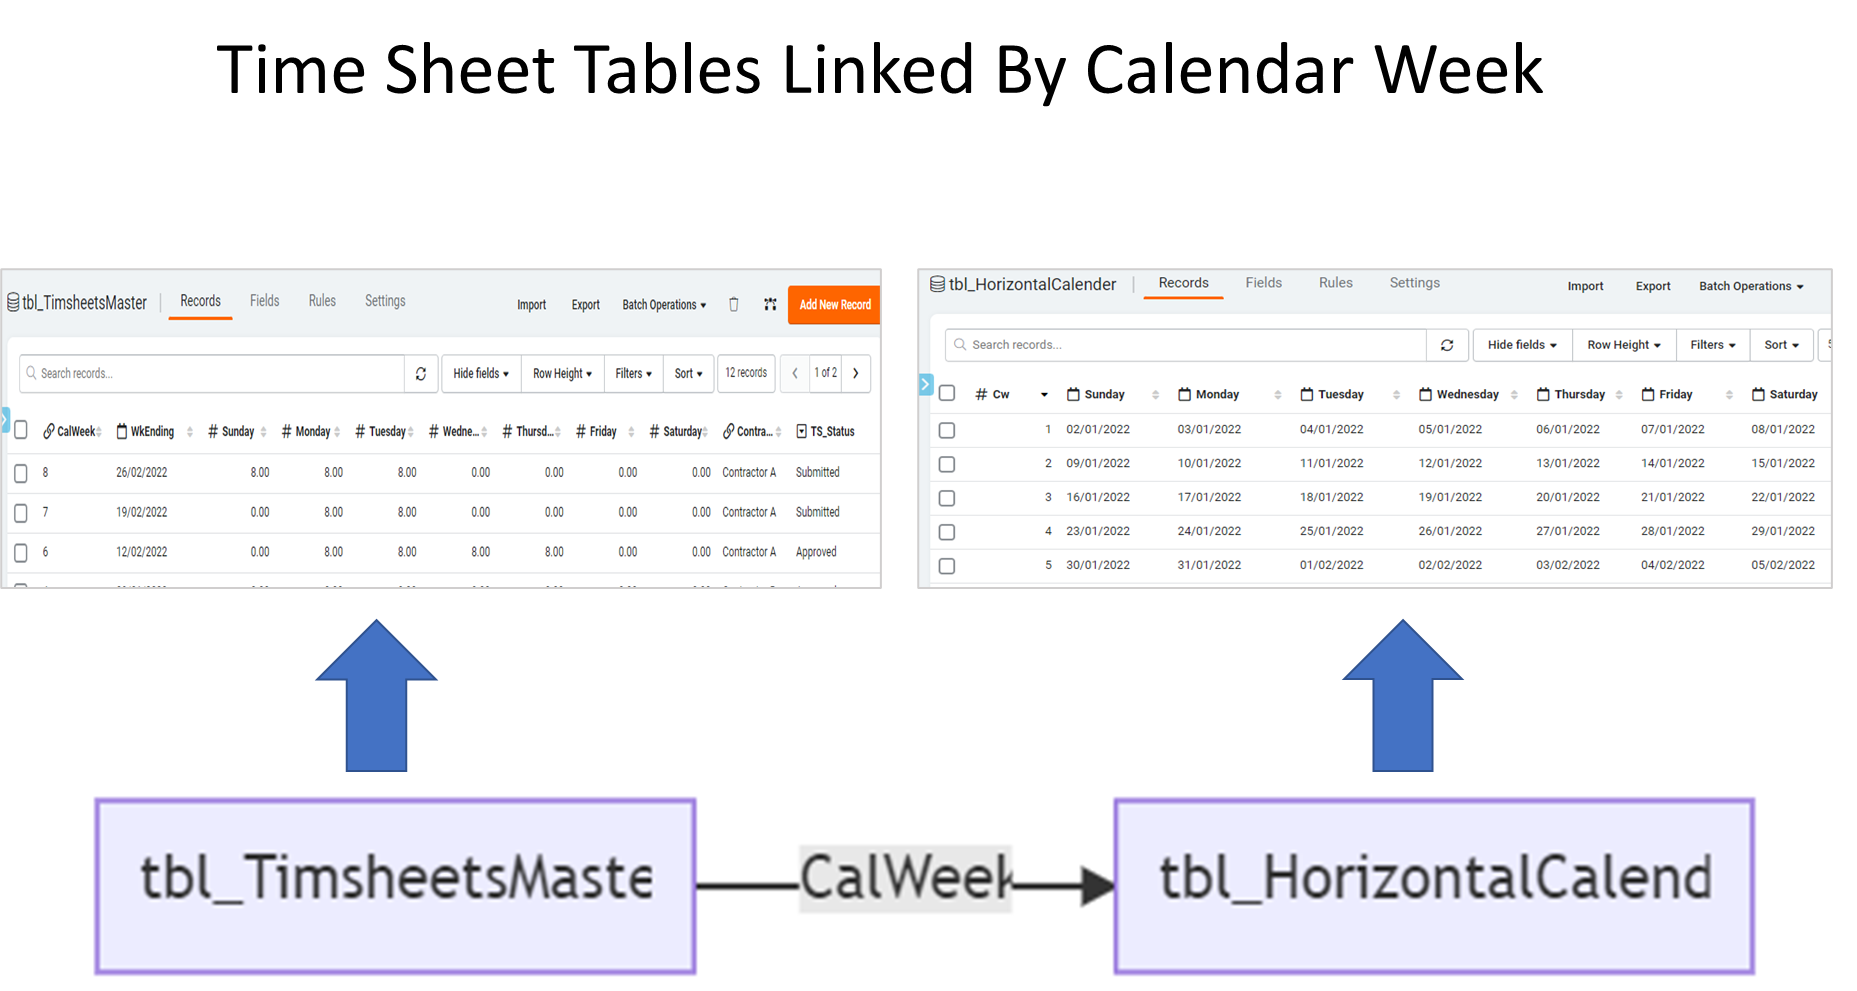
Strange design but yes it does work! one table holds the calender, I imported csv from excel pivot table into this tb table. The other table holds the hours worked. Both table are connected using calendar week number. The front end needed some tricks to make input boxes align and also I used
.row {
display: flex;
}
the flex enabled me to display the time sheet in one line on all devices.