Description:
Currently, pivot tables in Tadabase list records grouped by exact dates (day-level granularity), which results in too many individual date rows and makes analysis harder.
Requested improvement:
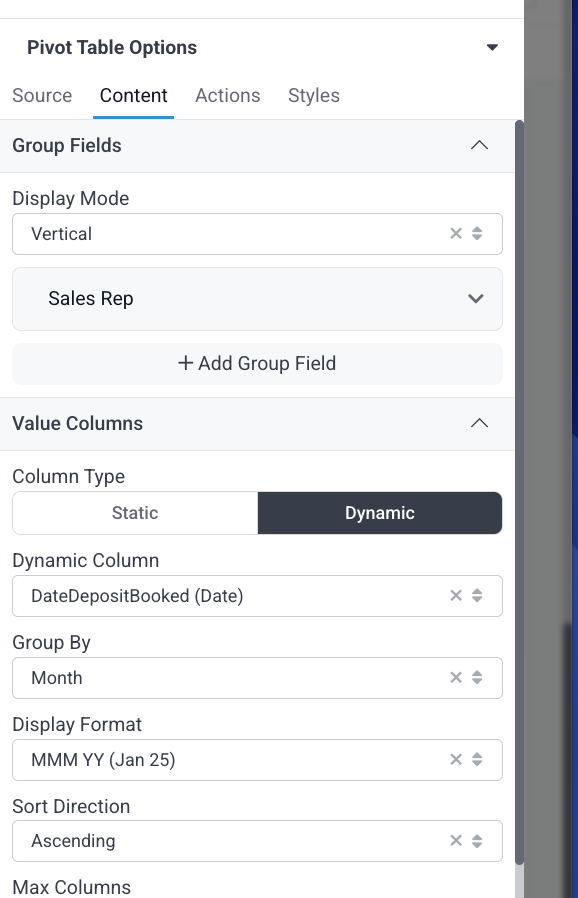
Add the ability to group pivot table data by time periods, such as:
- Weekly
- Monthly
- Quarterly
- Yearly
This would work similarly to pivot tables in Excel, where dates can be grouped into higher-level time buckets for clearer trend analysis.
Business value:
- Enables cleaner, more digestible summary views for sales, operations, and financial reporting.
- Helps managers and executives quickly see trends over weeks or months without exporting to external tools.
- Reduces reliance on third-party BI tools for basic time-based aggregations.
Example use cases:
- Monthly sales summaries by product or rep.
- Weekly pipeline activity counts.
- Quarterly revenue trend charts.
(I know I can use formulas to create new fields to extract dates to weeks, months etc but this is pretty messy especially as you need to do for every date field you need to analyse) .