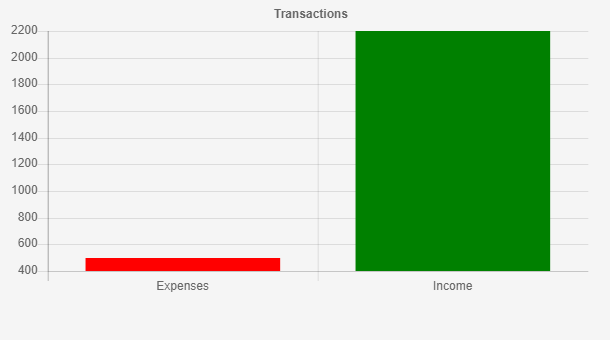
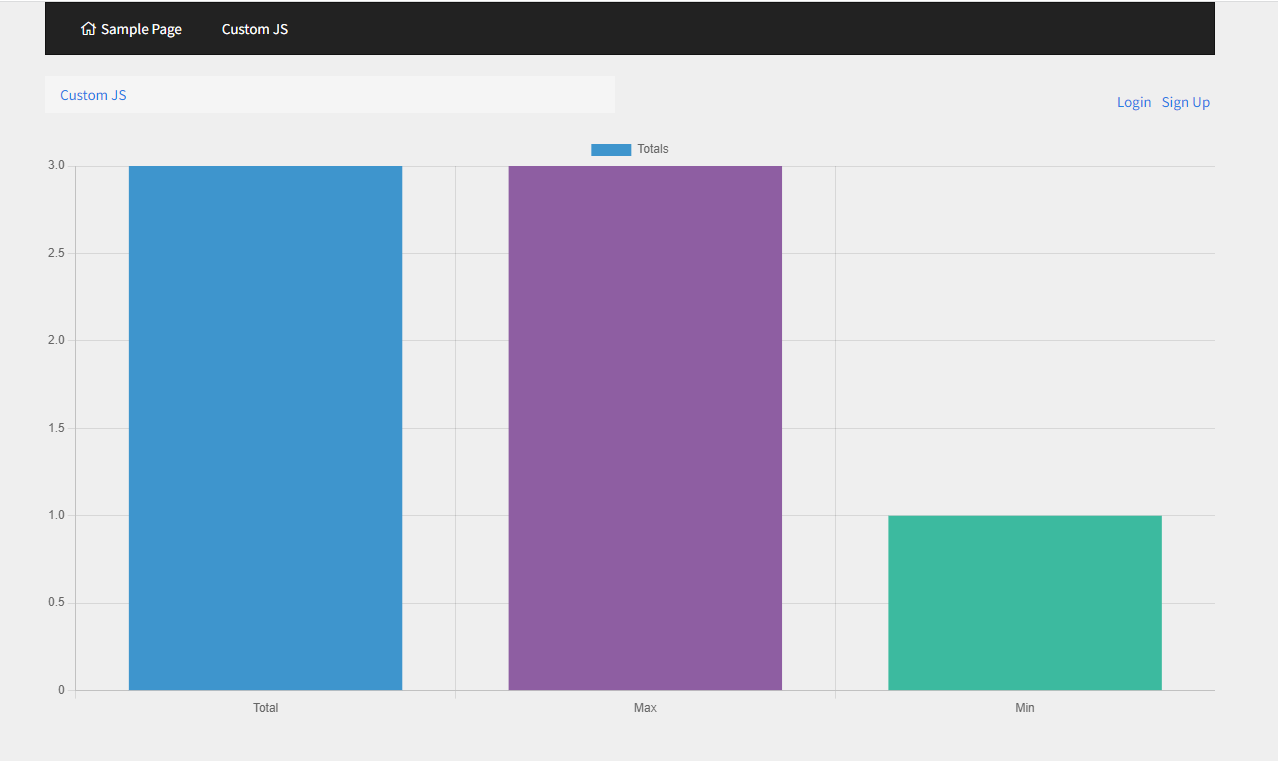
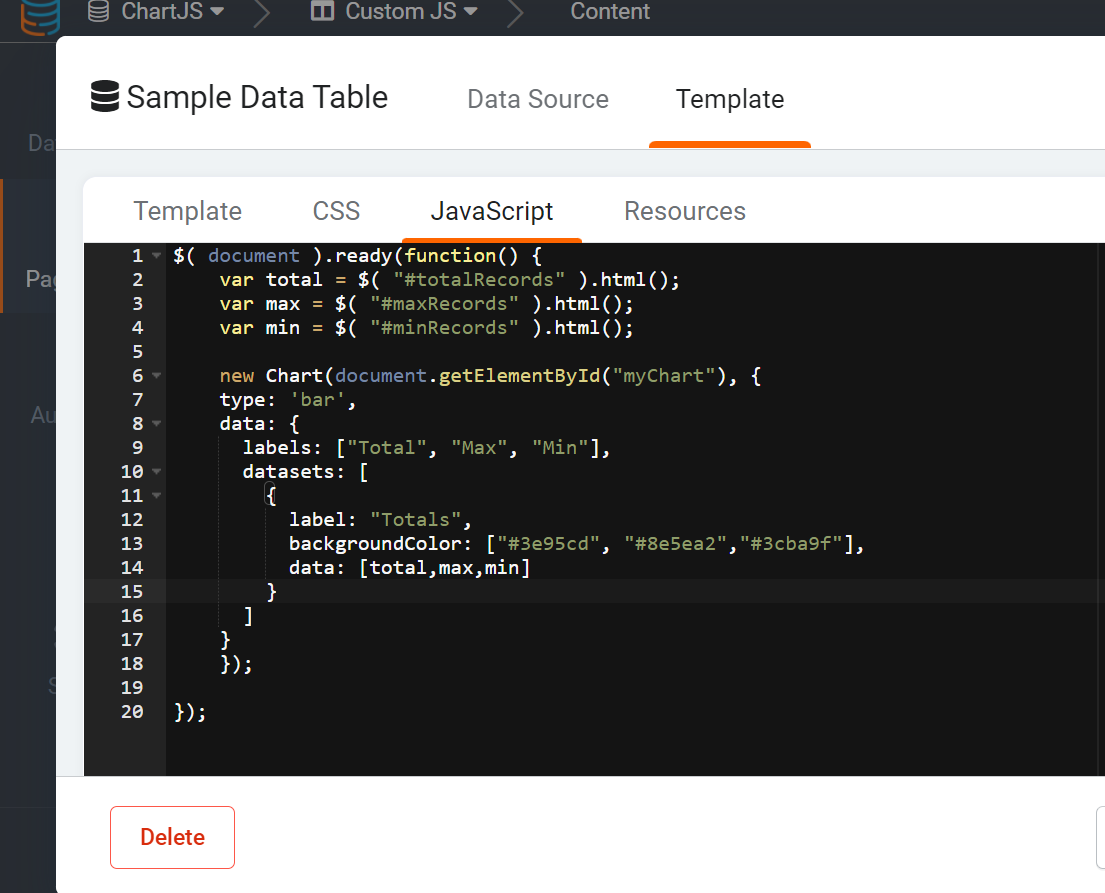
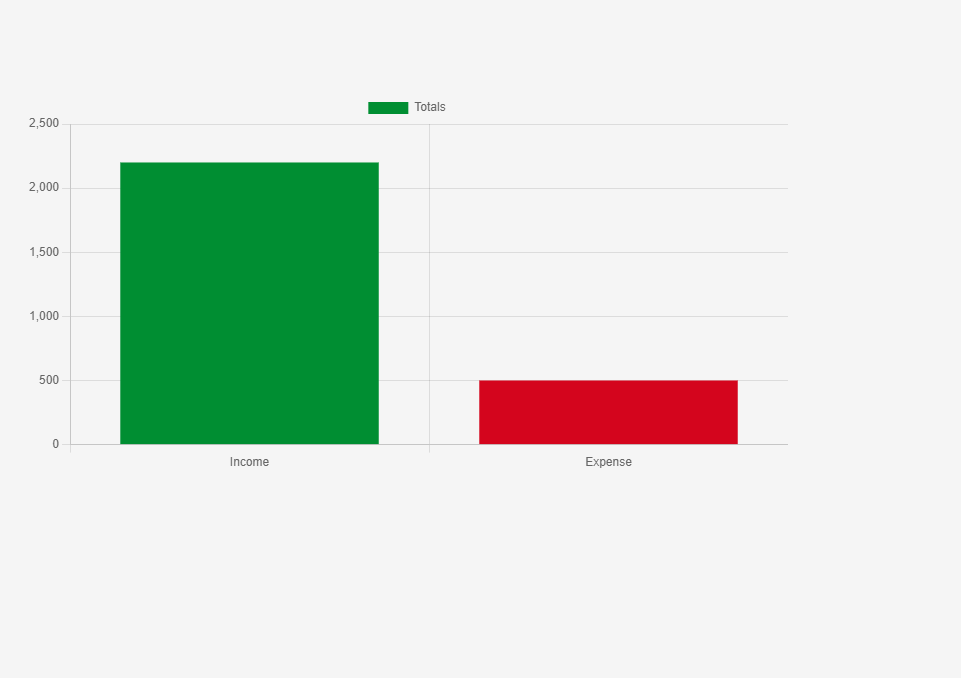
I copied the code, and it worked great for a chart.
Now I want to change the bar chart to a horizontal bar chart…
I only changed the type to “horizontalbar”, but unfortunately, it does not show.
Is the horizontal bar a new JS type or is TB not capable of reading it?
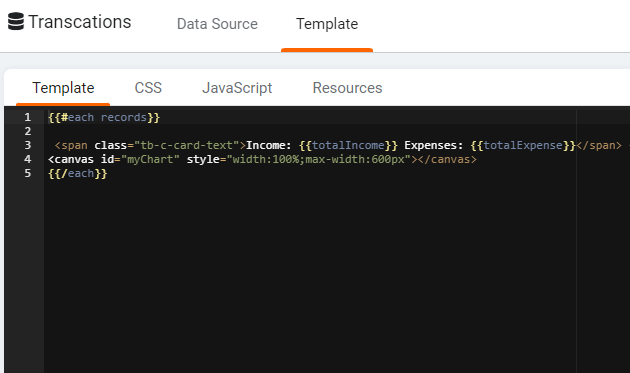
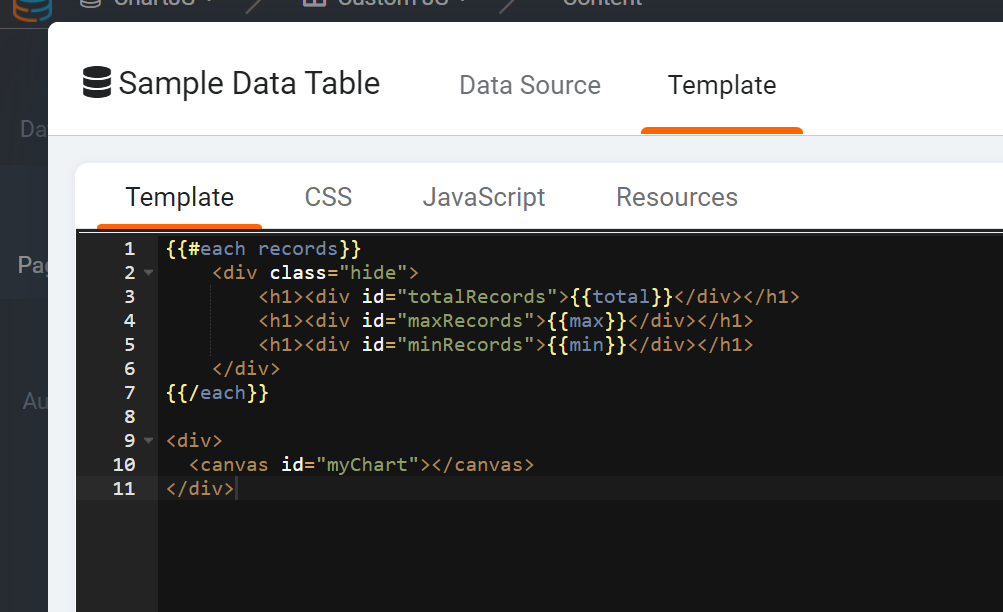
{{#each records}}
<div class="hide">
<h1><div id="overwaardeberekend">{{field_4022}}</div></h1>
<h1><div id="box1">{{field_3673}}</div></h1>
<h1><div id="box12r">{{field_3673}}</div></h1>
<h1><div id="box31">{{field_3924}}</div></h1>
<h1><div id="box32">{{field_4022}}</div></h1>
</div>
{{/each}}
<div>
<canvas id="myChart"></canvas>
</div>
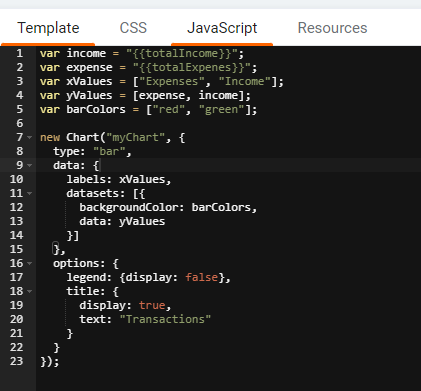
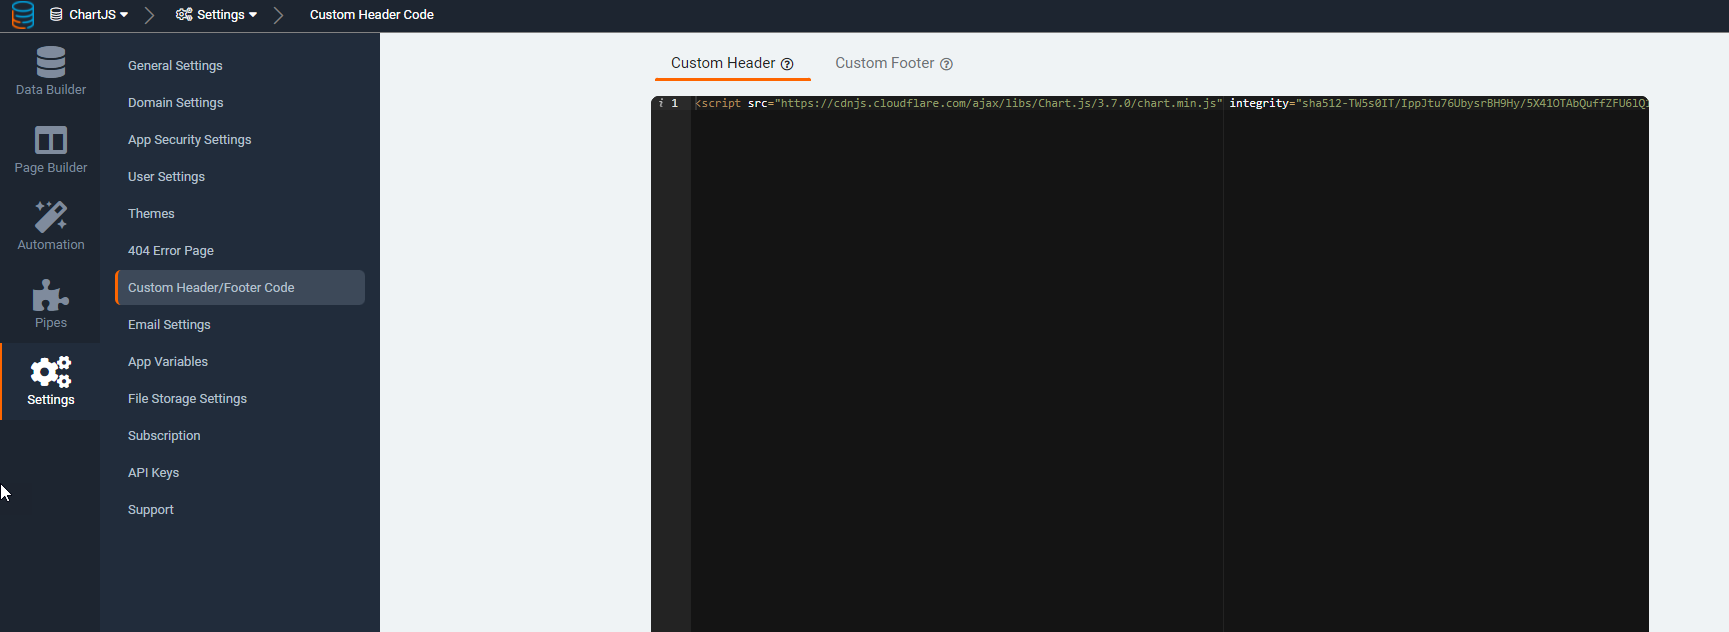
and the JS:
new Chart(document.getElementById("myChart"), {
type: 'horizontalBar',
data: {
labels: ["XXX", "XXXX", "XXXX","XXXX"],
datasets: [
{
label: "XXXXr",
backgroundColor: ["#030060", "#030060","#030060","#030060"],
data: [box1,box3,0,0]
},{
label: "XXXXX",
backgroundColor: ["#3CD458", "#3CD458","#3CD458","#3CD458"],
data: [box1,BOX2,0,0]
},{
label: "XXXXX",
backgroundColor: ["#EAB10B","#EAB10B","#EAB10B","#EAB10B"],
data: [0,0,xx,0]
},{
label: "XXXX",
backgroundColor: ["#9EA5B4", "#9EA5B4","#9EA5B4","#9EA5B4"],
data: [0,0,0,xx]
}
]
}
});
});