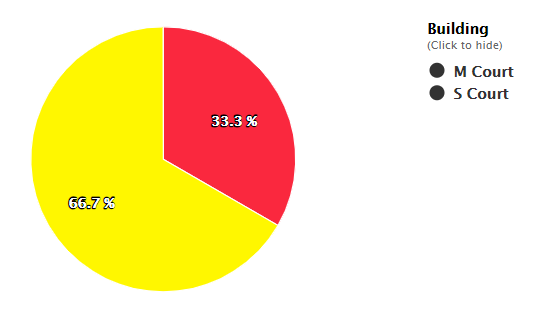
Hi there! Someone here who knows whether it is possible to change the colors of the charts in an easy way?
I was looking for a way to do this too for my pie chart.
I got it to work for the chart, but I couldn’t get the smaller icons on the legend to change too so I just made them the same color as the text. I might hide them.

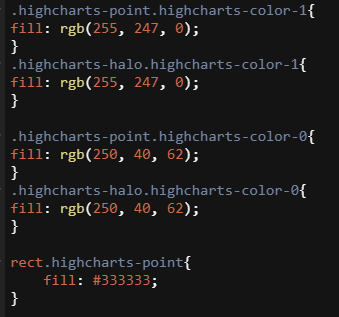
Here’s my code, the only problem is it applies to all charts on the page. The first two are for the yellow side, the next two are for the red side, and the last changes the color of the circles in the legend.

Change this css additional to your pie colors:
.highcharts-legend-item .highcharts-pie-series .highcharts-color-0
@CJeon where do you paste this code?
In JS or CSS?
Neither of them works for me and both show me errors
Can you please provide a broader snippet?
Here’s the CSS code that I’ve used in the past.
.highcharts-color-0, .highcharts-color-0 .highcharts-point{
    fill: red;
}
.highcharts-color-1, .highcharts-color-1 .highcharts-point{
    fill: blue;
}

.highcharts-color-2, .highcharts-color-2 .highcharts-point{
    fill: green;
}Hey @Chem, in the CSS editor on Tadabase, that code gives me an error that says “Fill” is an unknown property. Am I missing a step somewhere?
Did you save and try it anyways? Sometimes the warnings the editor gives still allow for the code to work.
Hi @Tophinity!
What @tim.young said and that the CSS editor seems to be unaware that the chart SVG we use, uses the property “fill” 