Column Chart based on Months

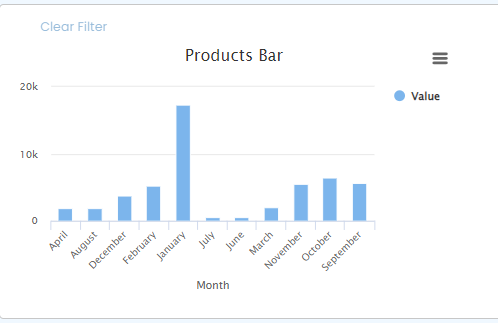
I have a column chart to show the values of commission sales per month. To do this i used the date utilites pipe to get the month name from the date field (sale date) and sorted on this, but it sorts the chart alphabetically.

I looked to see if i could get the month number from the date field but that is not an option in the date utilities pipe.

Any ideas on how i could achieve this please?

TB - column chart

1 Like

You can do this using an equation field in the data table:

CONCAT(DATE_FORMAT({Date}, “%m”)," - ",MONTHNAME({Date}))

This will format the date to this: 12 - December

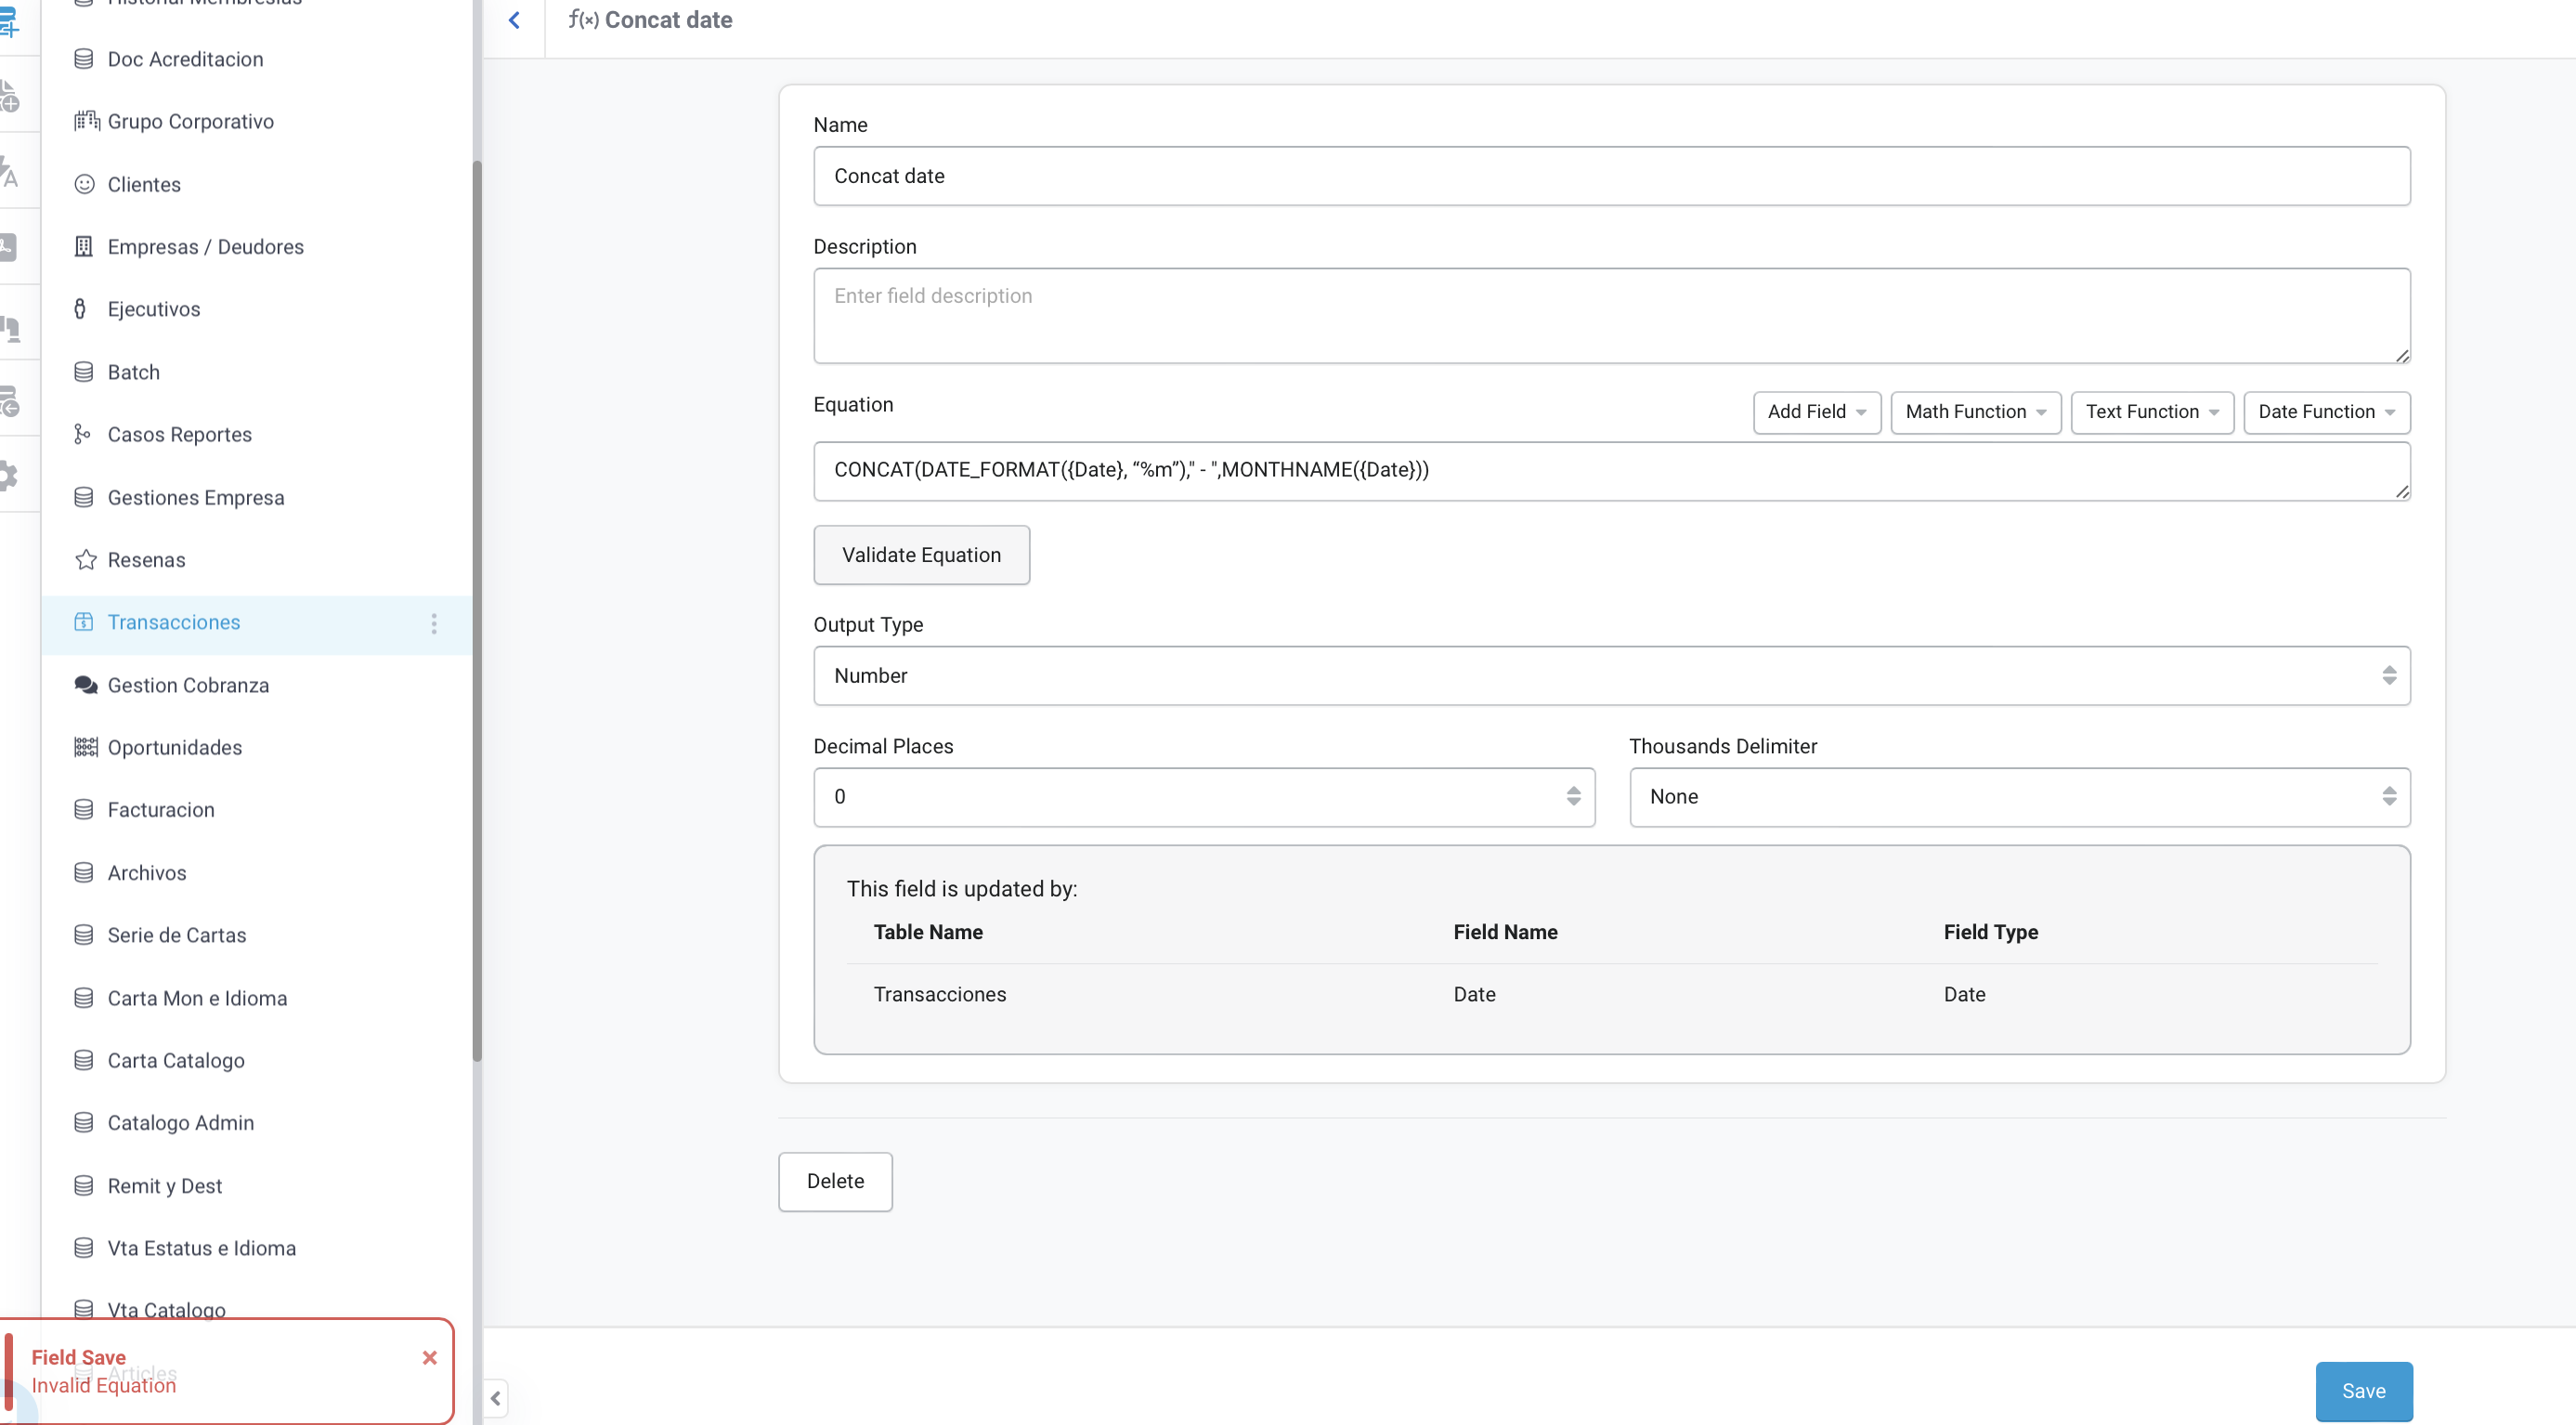
appreciate this @SuiteUpstairs and good to know about this feature.

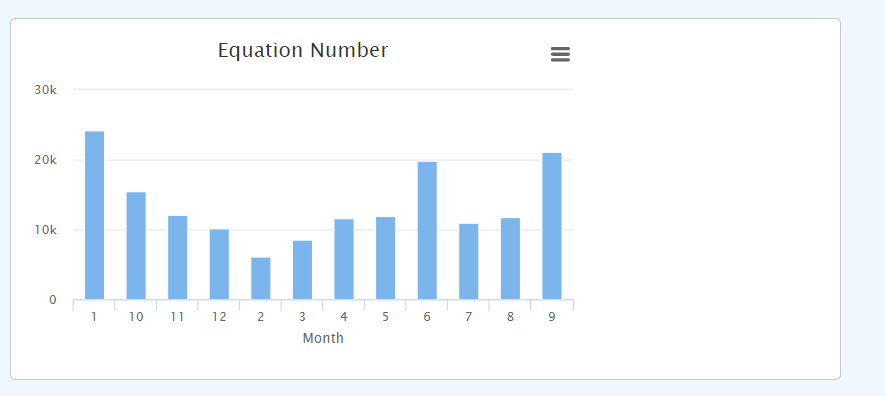
Having a small problem using this. If i choose the equation output as a number, the field is available to choose Group By in the chart setting but orders incorrectly.

If i change the output to Text the field is not available to Group By in the chart settings. I did find a way round it.

  • choose output as Number
  • select the field to group by in chart settings
  • edit the data table field to output by Text.

seems to still work and orders correctly.

1 Like

Yes, I forgot to mention that last night. I’m glad you were able to figure it out.

1 Like