@Shumon
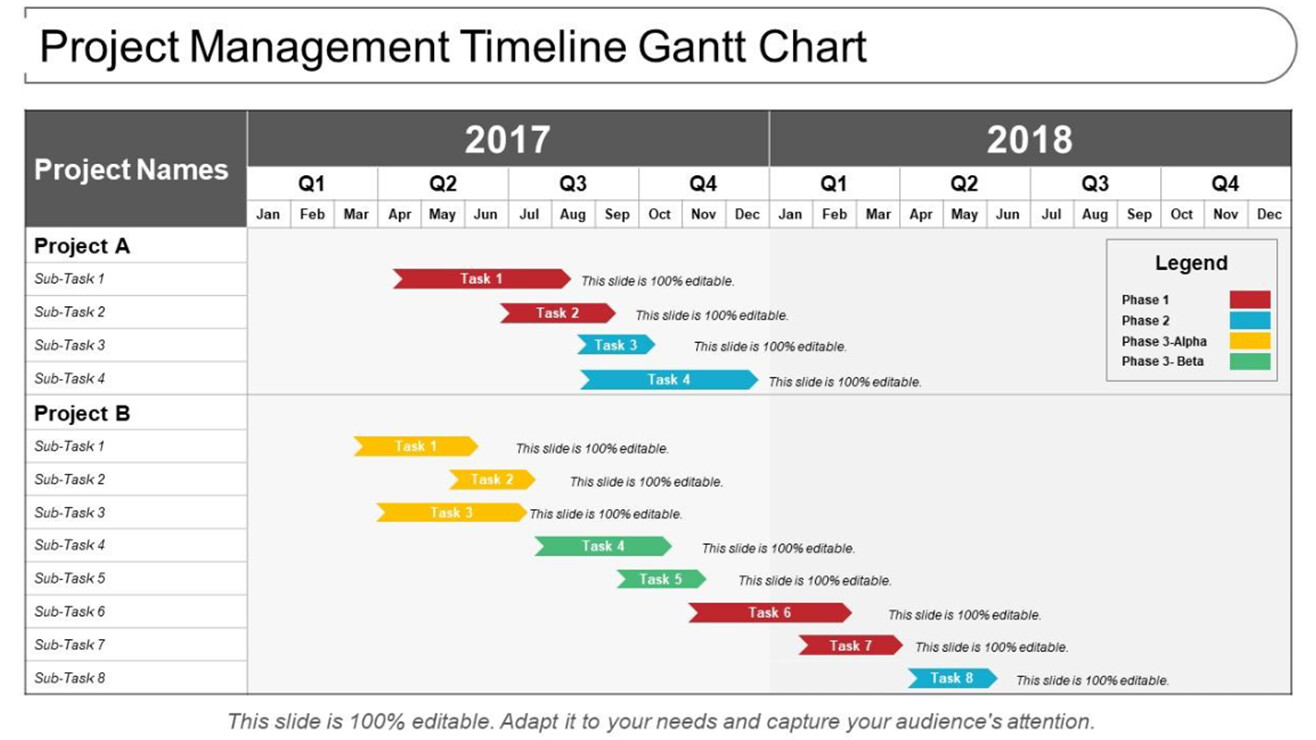
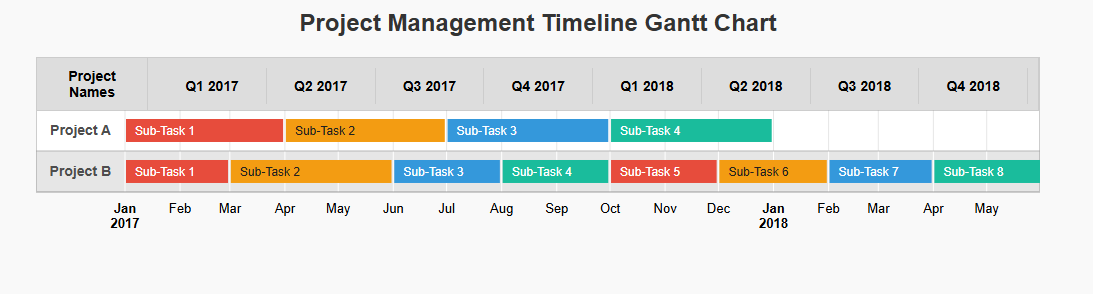
I’ve created a basic demo code using Google Timeline Chart based on your design. I thought this might be helpful to you.
<!DOCTYPE html>
<html>
  <head>
    <script type="text/javascript" src="https://www.gstatic.com/charts/loader.js"></script>
    <script type="text/javascript">
      google.charts.load('current', { packages: ['timeline'] });
      google.charts.setOnLoadCallback(drawChart);

      function drawChart() {
        const container = document.getElementById('timeline');
        const chart = new google.visualization.Timeline(container);
        const dataTable = new google.visualization.DataTable();

        // Define columns
        dataTable.addColumn({ type: 'string', id: 'Project' });
        dataTable.addColumn({ type: 'string', id: 'Task' });
        dataTable.addColumn({ type: 'date', id: 'Start' });
        dataTable.addColumn({ type: 'date', id: 'End' });

        // Add rows (Dynamically fetched data can be added here)
        const rows = [
          ['Project A', 'Sub-Task 1', new Date(2017, 0, 1), new Date(2017, 2, 31)],
          ['Project A', 'Sub-Task 2', new Date(2017, 3, 1), new Date(2017, 5, 30)],
          ['Project A', 'Sub-Task 3', new Date(2017, 6, 1), new Date(2017, 8, 30)],
          ['Project A', 'Sub-Task 4', new Date(2017, 9, 1), new Date(2017, 11, 31)],
          ['Project B', 'Sub-Task 1', new Date(2017, 0, 1), new Date(2017, 1, 28)],
          ['Project B', 'Sub-Task 2', new Date(2017, 2, 1), new Date(2017, 4, 31)],
          ['Project B', 'Sub-Task 3', new Date(2017, 5, 1), new Date(2017, 6, 31)],
          ['Project B', 'Sub-Task 4', new Date(2017, 7, 1), new Date(2017, 8, 30)],
          ['Project B', 'Sub-Task 5', new Date(2017, 9, 1), new Date(2017, 10, 30)],
          ['Project B', 'Sub-Task 6', new Date(2017, 11, 1), new Date(2018, 0, 31)],
          ['Project B', 'Sub-Task 7', new Date(2018, 1, 1), new Date(2018, 2, 31)],
          ['Project B', 'Sub-Task 8', new Date(2018, 3, 1), new Date(2018, 4, 31)],
        ];
        dataTable.addRows(rows);

        // Chart options
        const options = {
          timeline: {
            groupByRowLabel: true,
            rowLabelStyle: { fontSize: 14, bold: true },
            barLabelStyle: { fontSize: 12 },
          },
          colors: ['#e74c3c', '#f39c12', '#3498db', '#1abc9c'],
        };

        chart.draw(dataTable, options);

        // Generate dynamic quarters
        const startYear = Math.min(...rows.map(r => r[2].getFullYear()));
        const endYear = Math.max(...rows.map(r => r[3].getFullYear()));
        generateDynamicQuarters(startYear, endYear);
      }

      // Function to generate dynamic quarters
      function generateDynamicQuarters(startYear, endYear) {
        const quarterContainer = document.querySelector('#quarters');
        quarterContainer.innerHTML = ''; // Clear any existing quarters

        for (let year = startYear; year <= endYear; year++) {
          for (let quarter = 1; quarter <= 4; quarter++) {
            const quarterDiv = document.createElement('div');
            quarterDiv.textContent = `Q${quarter} ${year}`;
            quarterDiv.style.padding = '10px';
            quarterDiv.style.borderRight = '1px solid #ccc';
            quarterDiv.style.textAlign = 'center';
            quarterContainer.appendChild(quarterDiv);
          }
        }
      }
    </script>
    <style>
      body {
        font-family: Arial, sans-serif;
        margin: 0;
        padding: 0;
        background-color: #f9f9f9;
      }

      h1 {
        text-align: center;
        font-size: 24px;
        margin-top: 20px;
        color: #333;
      }

      .container {
        width: 90%;
        margin: 20px auto;
      }

      /* Header for Project Names and Quarters */
      #custom-header {
        display: grid;
        grid-template-columns: 1fr 8fr;
        background-color: #ddd;
        border: 1px solid #ccc;
        text-align: center;
        font-weight: bold;
        font-size: 14px;
      }

      #custom-header > div {
        padding: 10px;
        border-right: 1px solid #ccc;
      }

      #quarters {
        display: grid;
        grid-template-columns: repeat(auto-fit, minmax(100px, 1fr));
      }

      #timeline {
        height: 600px;
        margin-top: -5px; /* Align with header */
      }

      /* Legend Styling */
      #legend {
        width: 90%;
        margin: 20px auto;
        display: flex;
        justify-content: flex-end;
        font-size: 14px;
      }

      .legend-item {
        display: flex;
        align-items: center;
        margin-left: 20px;
      }

      .legend-color {
        width: 16px;
        height: 16px;
        margin-right: 5px;
        border: 1px solid #ccc;
      }

      .phase-1 {
        background-color: #e74c3c;
      }

      .phase-2 {
        background-color: #f39c12;
      }

      .phase-3-alpha {
        background-color: #3498db;
      }

      .phase-3-beta {
        background-color: #1abc9c;
      }
    </style>
  </head>
  <body>
    <h1>Project Management Timeline Gantt Chart</h1>

    <div class="container">
      <!-- Custom Header -->
      <div id="custom-header">
        <div>Project Names</div>
        <div id="quarters"></div>
      </div>

      <!-- Google Chart -->
      <div id="timeline"></div>
    </div>


  </body>
</html>