Greetings Tada Community-
Since Tada’s current charting components are basic in nature, has anyone worked magic and integrated Google Charts into their app(s)? If so, I’d like to connect. I am not sure this is even possible without using Zapier or Integromat.
Thanks much,
ashnil
September 20, 2021, 6:37am
2
@SafetyUniversity
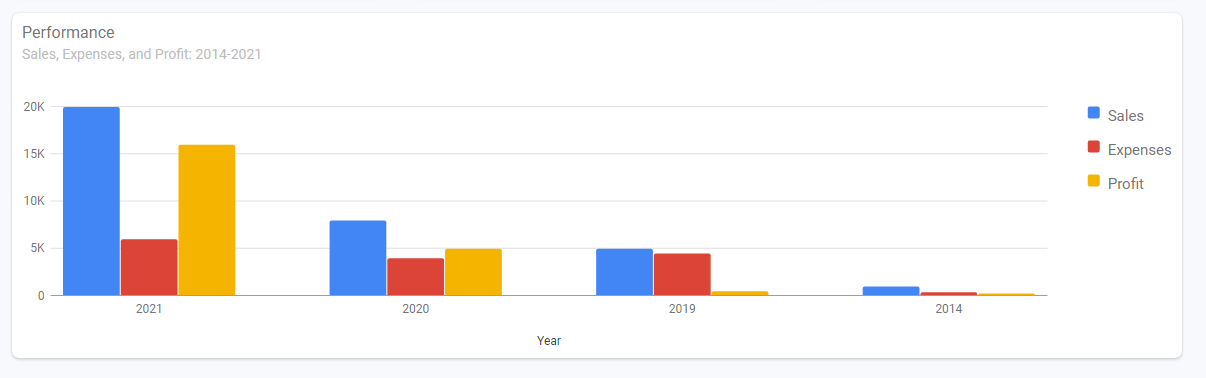
You can create something like below to display data from table
You can use DataTable component and set its record limit to 250(for displaying chart data) or you can use api’s to get data from tables. I have used DataTable component for below example
Step 1: Under settings > custom footer add below script taghttps://www.gstatic.com/charts/loader.js ”>
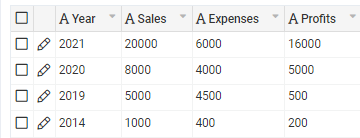
Step 2: Add datatable to page, add fields which you will be using for charts. Add CSS class to your table “snip-table-hide” to hide your table from UI.
Step 3: In CSS tab hide the table using css#fff ;
Step 4: Create a HTML component where you want to add charts. click on “<>” in custom editor and add below
Step 5: Add below JS code (change component and field accordingly)https://developers.google.com/chart/interactive/docs/gallery/columnchart#creating-material-column-charts ”
    (function() {

      let dataArr = []; // your data for chart

       TB.render('component_20', function(data) {
           dataArr = [];
           dataArr.push(['Year', 'Sales', 'Expenses', 'Profit']);
           // loop though the data.
           data.records.forEach(item => {
               dataArr.push([item.field_164, parseInt(item.field_165), parseInt(item.field_166), parseInt(item.field_167)]);
           });

           google.charts.load('current', { 'packages': ['bar'] });
           google.charts.setOnLoadCallback(drawChart);
       });

       function drawChart() {
           let data = google.visualization.arrayToDataTable(dataArr);

           let options = {
               chart: {
                   title: 'Performance',
                   subtitle: 'Sales, Expenses, and Profit: 2014-2021',
               },
               is3D: true
           };

           let chart = new google.charts.Bar(document.getElementById('columnchart_material'));
           chart.draw(data, google.charts.Bar.convertOptions(options));
       }

    })()
Wow @ashnil -
This is awesome! I’ll dig into this shortly. Would you happen to know if this will work on the PDF page as well?
I very much appreciate your help!
@ashnil -
Much appreciate all the guidance you provided. I failed at synthesizing your details into a line chart vs. a bar chart. Would you be willing to provide some instructions on a line chart integration?
https://developers.google.com/chart/interactive/docs/gallery/linechart
What I have worked up so far…chart doesn’t show any data, just a blank white box.
(function() {
let dataArr = []; // your data for chart
TB.render('component_107', function(data) {
dataArr = [];
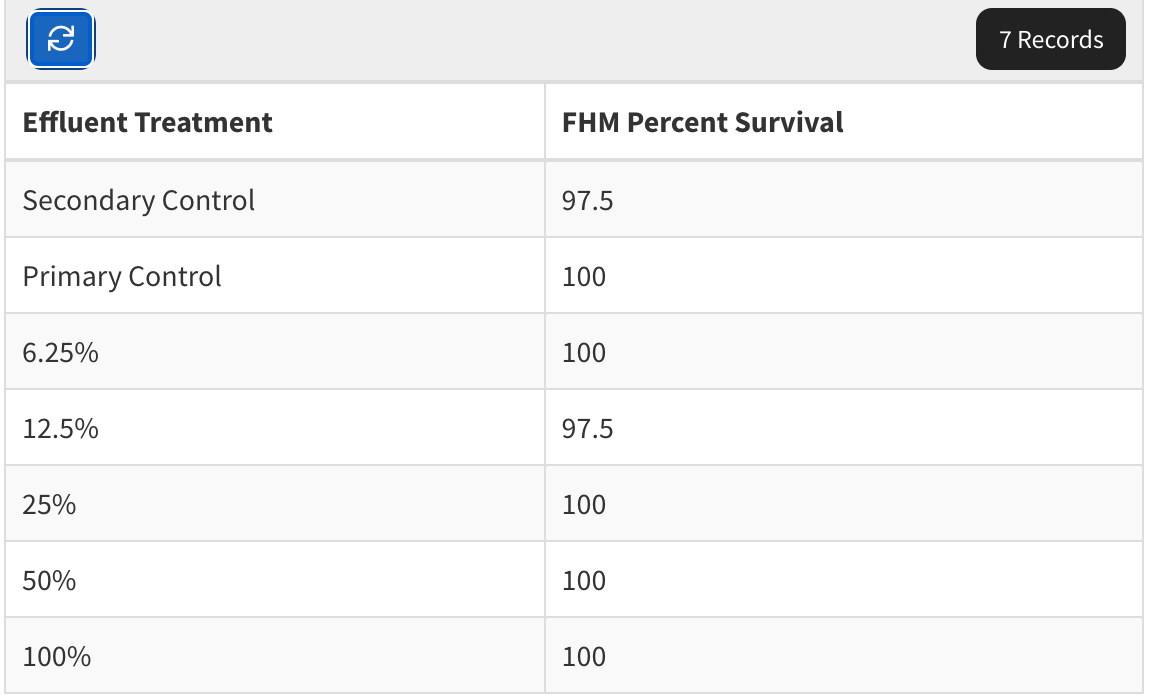
dataArr.push(['Effluent', 'Percentage Survival']);
// loop though the data.
data.records.forEach(item => {
dataArr.push([item.field_655, parseInt(item.field_660)]);
});
google.charts.load('current', { 'packages': ['line'] });
google.charts.setOnLoadCallback(drawChart);
});
function drawChart() {
let data = google.visualization.arrayToDataTable(dataArr);
let options = {
chart: {
title: 'Acute Fathead Minnow Survival',
subtitle: 'Percent Survival',
},
};
var chart = new google.charts.Line(document.getElementById('linechart_material'));
chart.draw(data, google.charts.Line.convertOptions(options));
}
})()
NOTE: Div id was changed to “linechart_material”. field_655 is the Effluent table column and field_660 is the Percent survival table column.
Many thanks in advance,
BINGO! I found the issue.
The app custom header/footer code should be (the “…charts.load” script was missing):
<script **src="https://www.gstatic.com/charts/loader.js"** ></script>
<script>
**google.charts.load('current', {packages: ['corechart']});**
**google.charts.setOnLoadCallback(drawChart);**
...
</script>
Which was preventing the entire script to be executed properly.
Thanks for all of your help @ashnil
Shumon
May 10, 2022, 12:39am
6
Top class Adam !! I got my chart working after few attempts.
Its not working for me. I tried the same thing but nothing shows up