In my existing App I have created a monthly workload calculator that creates an annual planner showing workload in each month per project. Each of our projects are 4-6 months in duration.
We take the expected workload(hours) within each project we are working on (and have coming up) and use the start and end dates to calculate the workload per project / per month.
From this I have created a year planner showing all the projects and all the workload and totals per month. This is a simple table view shown above. But, simple as this view is, its become an important tool for us to plan our capacity and workforce. And, as we allocate work to staff, can see the same monthly breakdown per person across a year planner.
It works great BUT…
To create this view, I have had to create extra fields in the projects table for each month in the year, and a complex calculation for each field to work out the value for that month. And as we move forward into future years I will have to create more and more fields with complex calculations in each. And … As a project only runs for a few months in a lengthening time period, most of these fields will be zero. It’s clear that what we have is not a long term solution. For I cannot have unlimited fields in a table and even if I could it would be grossly inefficient.
So it occured to me that what I want to create is a limited set of fields that carry some ‘two dimensional data’.
For example:
If we said that no project will last more than 6 months, then I should only have a maximum of 6 fields to hold the 6 workload/month values. And each of those fields should hold two pieces of data … The year/month that they apply to (which will be between the project start and dates) and the calculated workload value for that month - based on working days in that month. I imagine this is 2 dimensional data is almost like coordinates.
I can conceive this, but I can’t see how I could easily store two values in one field, in just six fields, in such a way that I can readily recreate a Table view like the one above that will show the 12 months workload planner - where the six fields of data for any specific project will be shown in their correct months .
I have developed a program that deals with a similar issue: allocating depreciation by month for each item in inventory. The solution for me was not simple, but it works. It involves using table rules for each month.
In our case, we either include a month 100% or 0%, so I haven’t dealt with partial allocation in a month. But I would advise you to approach your problem with table rules, and apply the rules to each record to store the result your table, rather than look at your six-month window.
If your number of projects is small, you could have your program prompt for the number of workdays in the first month (I would use a spreadsheet). Then use rules to allocate the hours in each month (based on workdays in that month, which you could store in another table) until they run out.
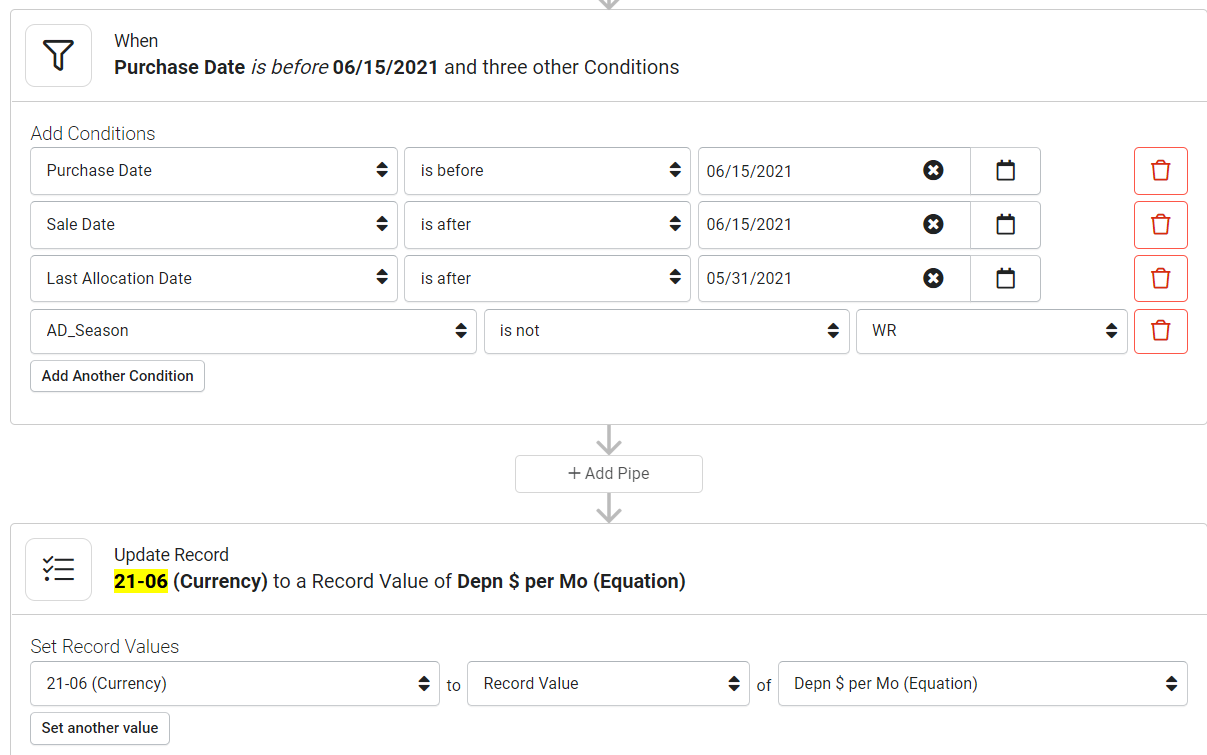
Here’s a sample of one of the rules I set up in our program. You need to create the same set of rules for each month going forward, but if your rules are set up correctly, it should apply to all projects in those months.
Yours is an interesting case. A few years ago I used to ran a major Rental Company and so your focus on depreciation is very familiar to me. And your idea of using table rules is certainly interesting too, as the complexity of the nested sequence of IF() statements I currently use more than makes my eyes boggle - rules are easier.
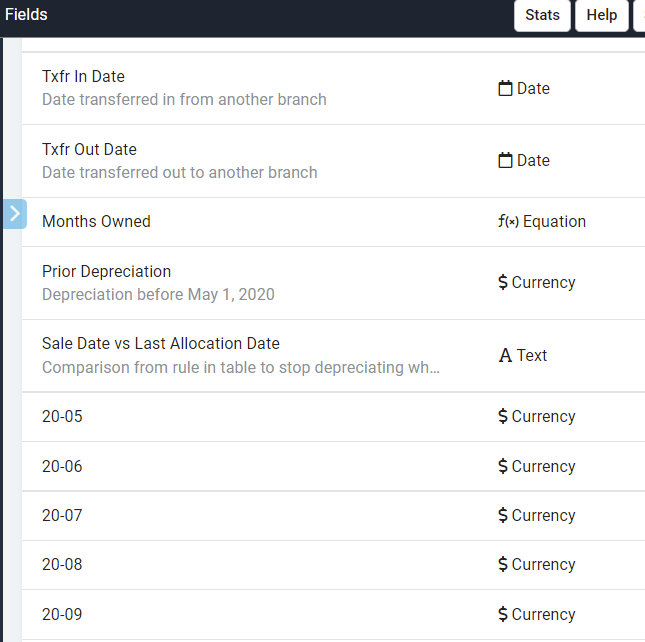
But ultimately I think you are recording these values into separate fields just as I am. I can see taht you have a field ‘21-6’ and presume there is also ‘21-7’, ‘21-8’ etc. Depending on what kind of assets these are you might be depreciating over several years and so, for you, multiple deprecation/month fields for each asset are essential.
For me, with our projects spanning just 6 months, I was hoping to find a way not to have to have 24 extra fields per project for the next two years. Because only 6 of those fields would be ever be populated - but all of them would have to be calculated.
Maybe I just have to live with it.
… but that makes me think.
Maybe I just need the extra columns, one for each month. Each row will just have to have even more columns. At least, that way, its clear to me how I create the year-planner / table view that I need.
But what I really need to do is to separate the calculation and the display of the values within the cells. I don’t want thousands of cells each trying to do a calculation.
It would be better to calculate only when the row is created or edited, with the values posted into the correct year/month cell. This seems like a job for Rules, but somehow I’d need to make the rule post to a variable column … hmm
You will need one field for each month. There will be one record for each project. There will be at least one rule for each month.
Fields from my table: