Is there a way I can make a chart clickable and link it to the data it represents?
As an example:

When I click the 40.0% or the Legend at the right. It will show the data that has all 3 completed. Is this possible? I really need help. Thank you
Is there a way I can make a chart clickable and link it to the data it represents?
As an example:
When I click the 40.0% or the Legend at the right. It will show the data that has all 3 completed. Is this possible? I really need help. Thank you
This is not possible at the moment. The data is being fully calculated behind the scenes and no information about the records is being returned when the chart loads.
I see the use case for this and will ask someone to look into perhaps being able to do this using another library.
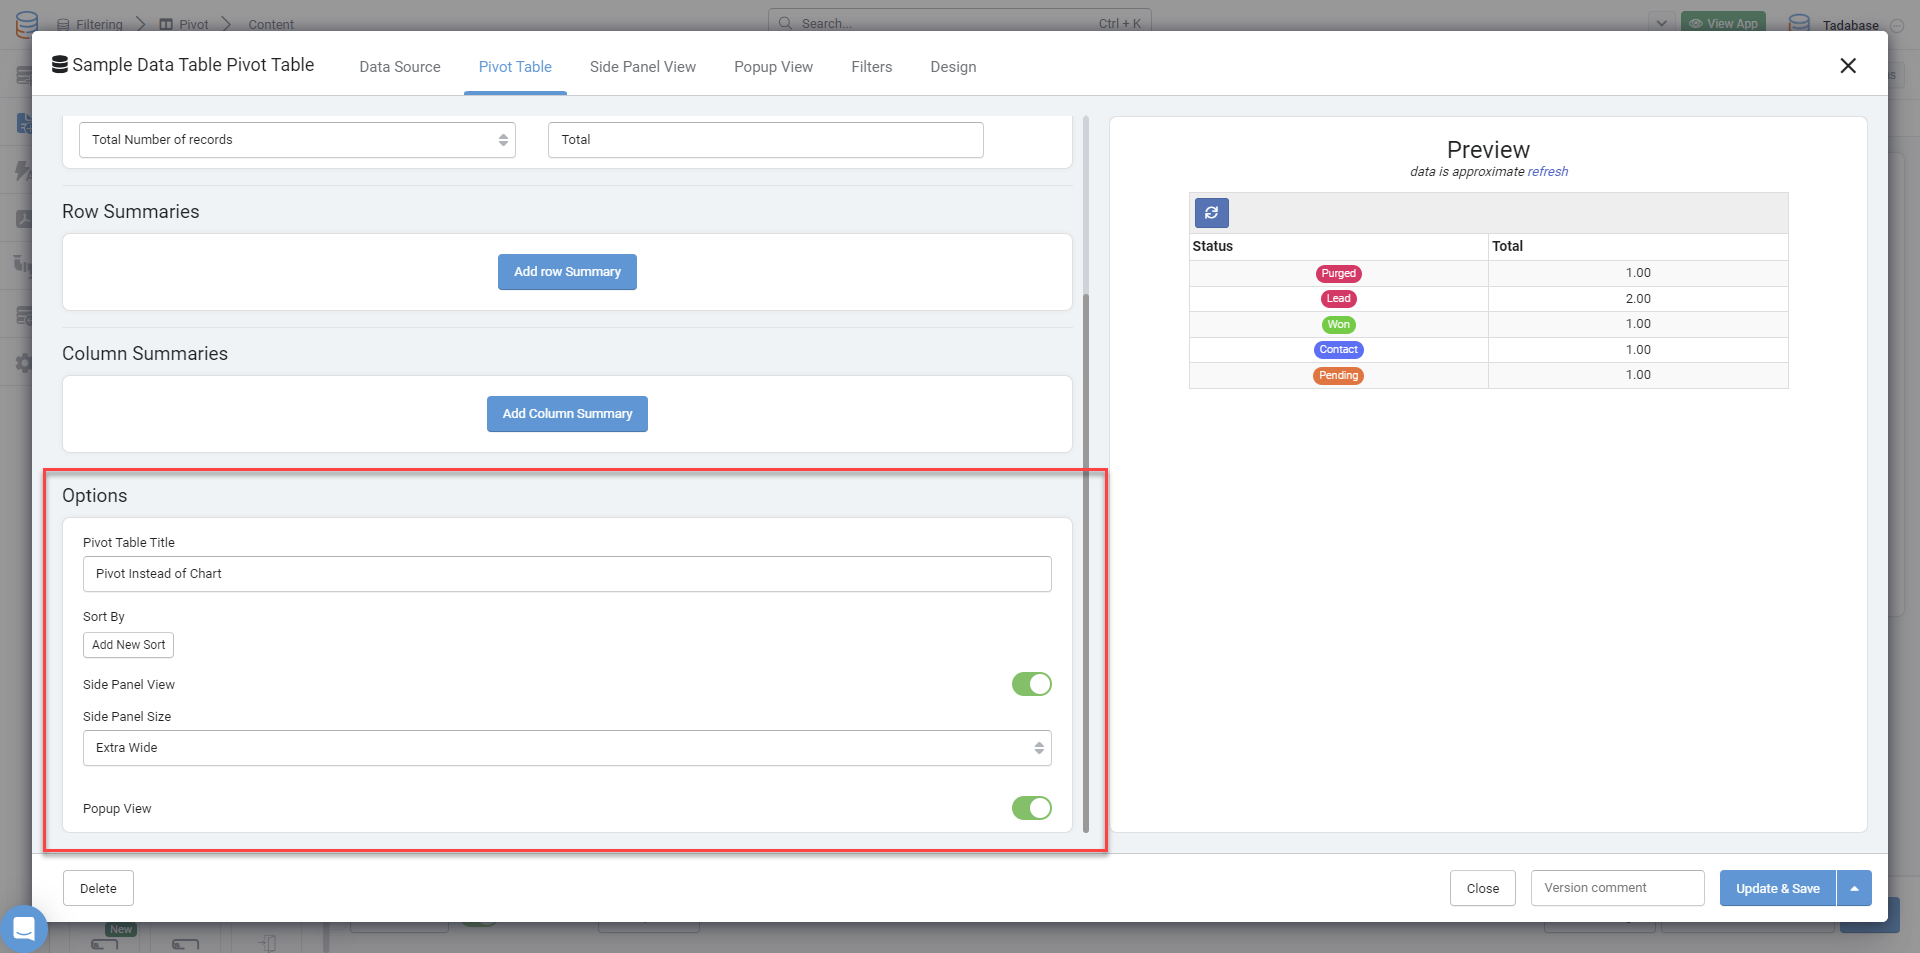
It’s not a perfect workaround solution, but you can try using Pivot for the data instead of charts.
For example, here were’ showing the same data as a chart, but in a table. You can then click on it and see more details:
You can find the settings to enable this here:
I hope this helps
Thank you! I will look into it ![]() cheers!
cheers!