Pivot Table Sales Forecast

Hi Folks
we have built a Sales Opportunity Tracker …essentially a Sales pipeline tool.
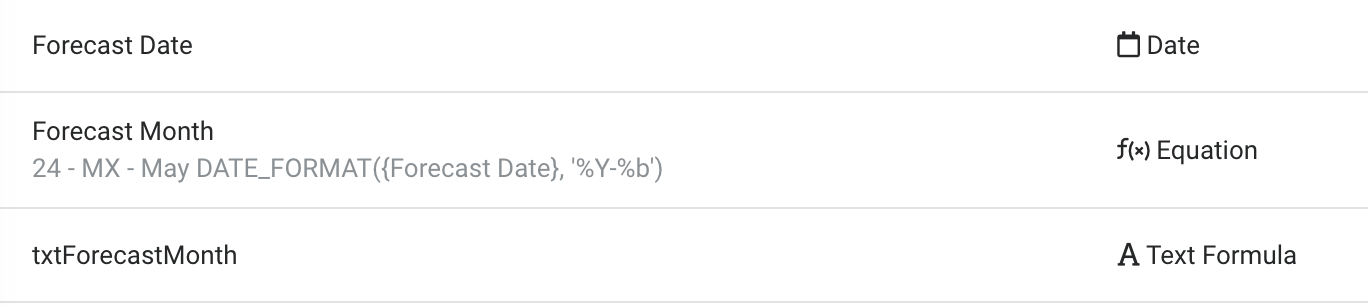
We enter various data re the opportunity including expected $ Value and the Forecast Close date. I have built various sales analysis reports
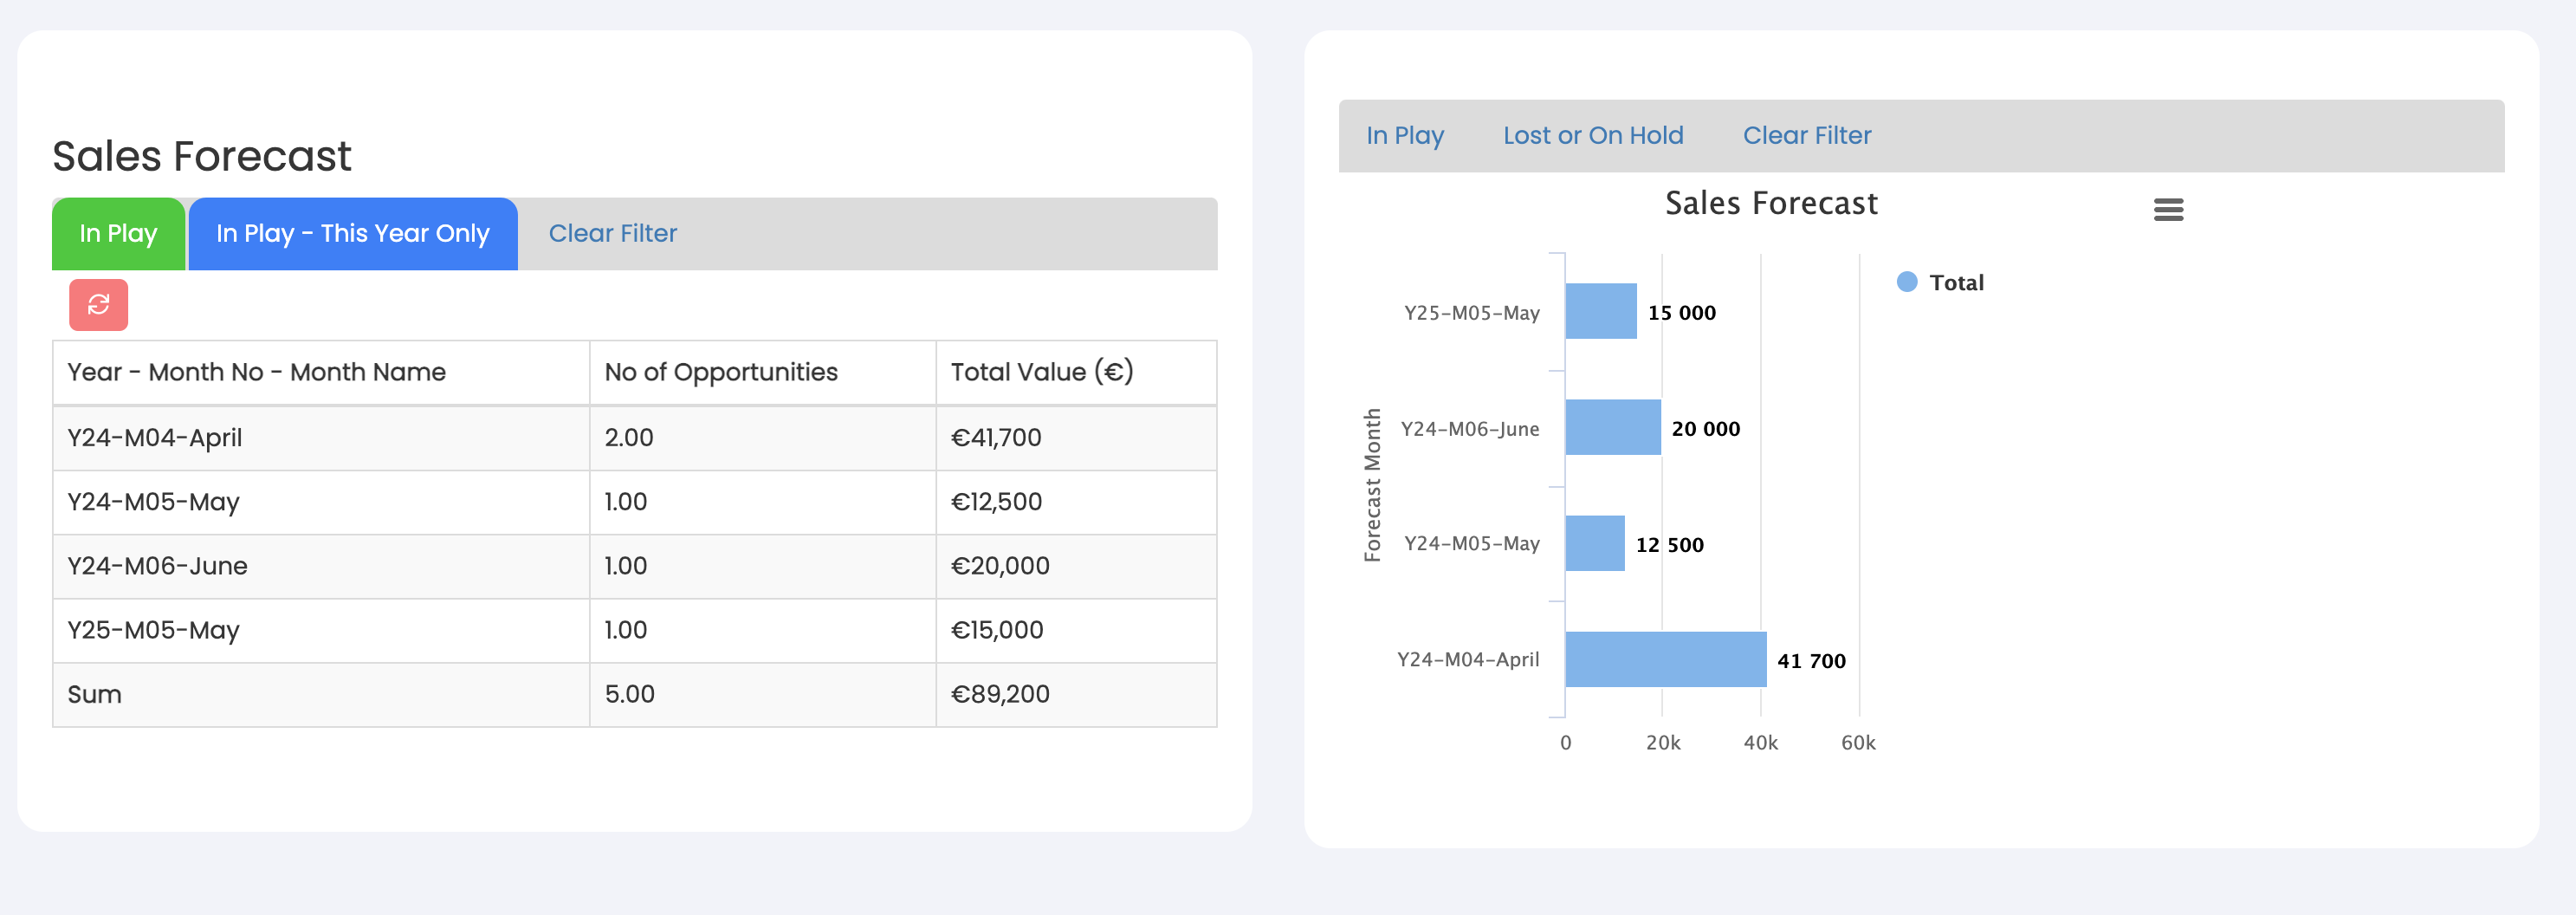
I’d like to be able to build a sales forecast report which shows a Forecast by Month of the total opportunities for that month
e.g.
_____ | Jan | Feb | Mar | Apr | May | Jun | Jul |
Sales. |$5K | $8K| $9K |$8K|

Would be nice to have sub categorises by status etc
There does not appear to be a way to do this kind of timer series in Pivot Tables … ?
Anybody else cracked this …or what tool/how you mmight have if not TD native
Appreciate your advice
regards
Noel

Hi

I managed to come with a (kinda) workaround for this by creating an equation field that parsed out the Year- Month Number and Month Name.

So Equation Field with Formula: DATE_FORMAT({Forecast Date}, ‘Y%y-M%m-%M’)

I add the Month Number (so e.g. May is M05) as this allowed me sort the pivot component and chart component in correct month sequence number and not by Month Name.

I then (had to) create a text version of that eq field, as the Equation Field was not accessible from either the pivot table component or chart component.

Forecast Field and two variants

This is my Forecast Table and Forecast Chart I ended up with:

Hope this helps some one

tks
Noel
P.S. If better way to do this Im open to suggestions :slight_smile: