Hi.,
Has anyone experiencing in using the table/ charts component to show data which is listed on a details component? I can only select full datables, or lists connected to a user. Say, I have a user with a list of 3 connected records. I want to show the user to click on “details” and then see the data (from each connected record separate) in a table or chart…
Can someone help me with this matter?
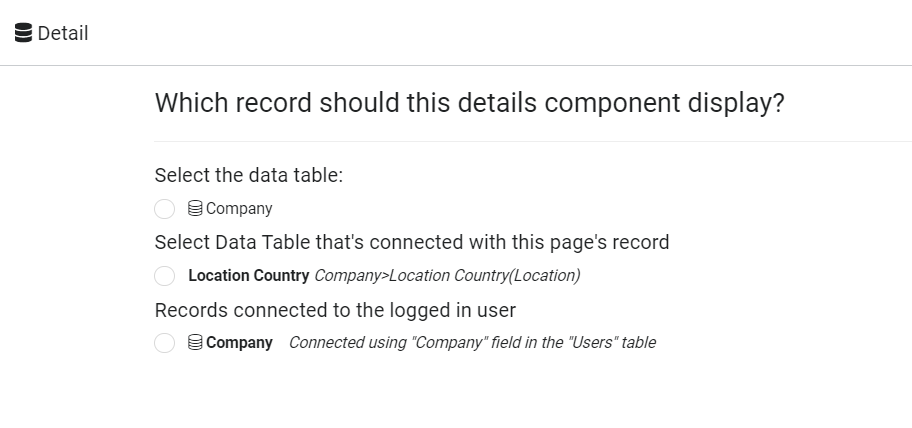
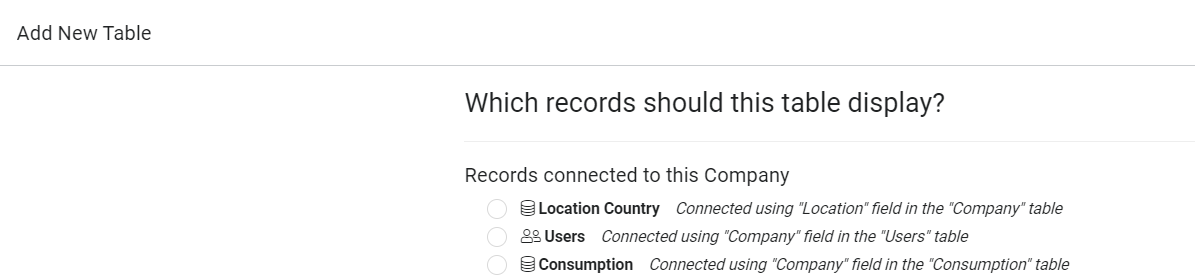
Are you asking about showing connected values in the Details page? I think you can add another Details or Table component in the Details page. You will be prompted to select the table to display.
@philipteng,
No, In want to show the results from an API call as a table… My response looks like this:
‘field1’ 'field2; ‘field3’. ‘field4’. ‘field5’. ‘field6’ etc…
100.000 110.000 120.000 130.000 140.000. 150.000
When a API call is run, a row is added… But the 2 rows will show different results…
Above results can be shown as a table, but not as a graph…
Your API is called through a pipe, and the response is saved into the record?
Seems like you need to use the new Tadabase feature of loading external data for display. Tim is probably in a better position to explain how this new feature works.
@philipteng,
the results are from an (internal) TB Excel Pipe… and indeed saved as records.
The external data function is therefore not suitable for this purpose unfortunately…
@Kristen
Is there going to be an update on the chart features which can be used on a details component? E.g. A record contains field values (numbers) containing field value 1, field value 2… etc… all to field value 10…
My request is that I, only on a details page field, can create a standard TB chart contains 10 bars containing these field values.
Is this possible in the foreseeable future?
I can’t speculate on new or changed features.
That question would be better asked by emailing support @ tadabase.io, start a support chat, or maybe @Adi or @moe could comment if there’s anything shareable.