December has arrived and our team has definitely been feeling the magic in the air! ![]() Here’s the scoop on what we’ve been up to this past week:
Here’s the scoop on what we’ve been up to this past week:
![]() Our engineers have installed the AWS S3 Pipe! Woohooo!
Our engineers have installed the AWS S3 Pipe! Woohooo!
![]() You asked, we listened! We’ve updated our charts! You can now:
You asked, we listened! We’ve updated our charts! You can now:
- Add multiple series of data in the Bar/Column, Line and Area charts. Oh ya!
- Have charts that support connection fields.
- Bar/Column charts can now be standard or stacked
- Create charts that support Date fields
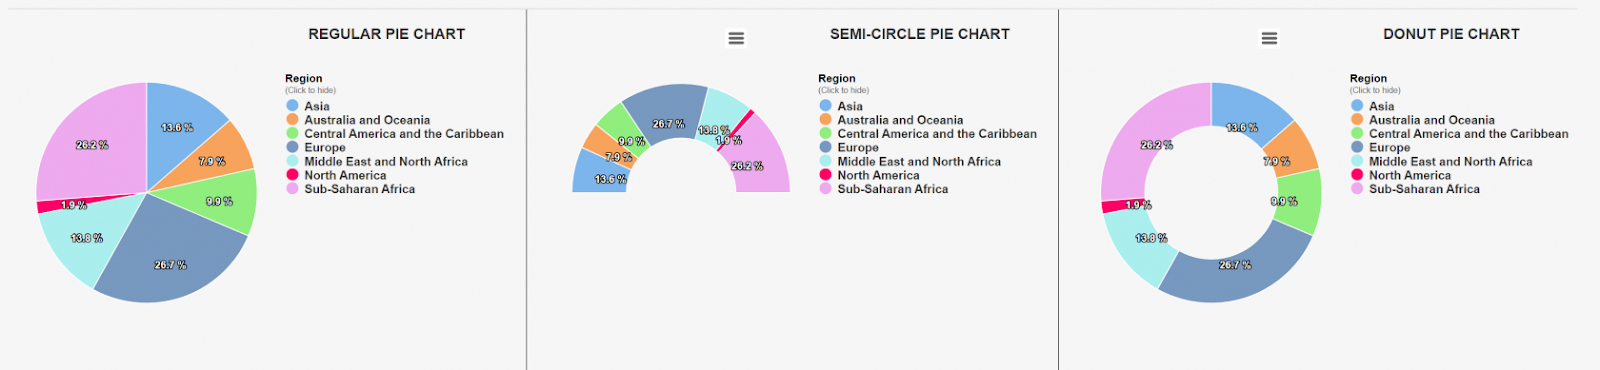
- New options in Pie charts: Semi-circle as well as Donut:
- Use new design themes with ability to define your own theme:

![]() Check out our newest case study on how Tadabase helps a Michigan-based snow & grounds company transform and manage their workflow! The Season for Autum(n)ation: How Tadabase gives Sneller Snow & Grounds’ 400 employees a clear path into the future. It’s a cool one!
Check out our newest case study on how Tadabase helps a Michigan-based snow & grounds company transform and manage their workflow! The Season for Autum(n)ation: How Tadabase gives Sneller Snow & Grounds’ 400 employees a clear path into the future. It’s a cool one! ![]()
![]() We’ve added more equation examples to our manual! Check out new Date Equation examples and Multi-Function Equation Examples
We’ve added more equation examples to our manual! Check out new Date Equation examples and Multi-Function Equation Examples
On this episode of Build it with Tim, learn how to iterate through a date range! Tim demonstrates how to iterate through a date range field to find all dates within the field and create new records in a new table for each date. It’s prettyy awesome, so take a peak! ![]()

![]() Snippet of the Week:
Snippet of the Week:
Scissors at the ready? Sometimes you just need the ability to delete inside an edit pop-up modal. And for that, we present this snippet on how to add delete functionality inside a modal. Snip the code!

Time out on this one! Happy building and see you next week! ![]()