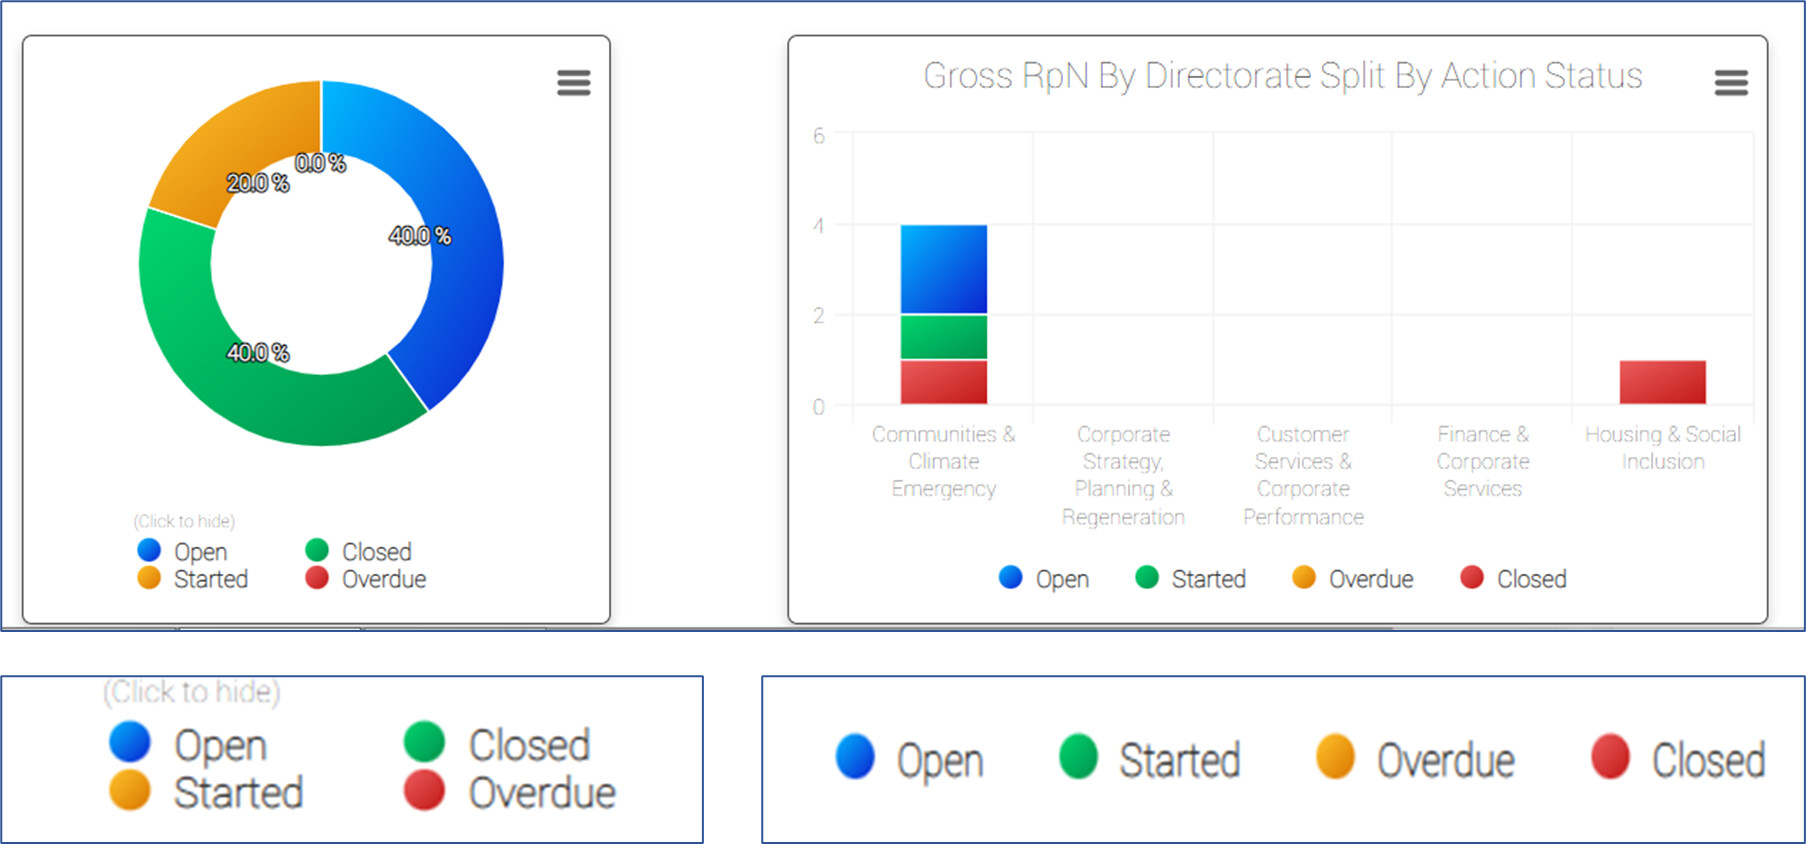
I have 2 charts which show total count for each Action Type: ‘Open’, ‘Started’, ‘Overdue’ and ‘Closed’ actions. Donut chart shows summary and the bar chart shows further details.
Currently, I am not able to choose the colors for each Action Type for both charts and therefore the legend colours currently dont make sense. I tried to set the colours by ascending/descending count result options in the chart., but this isnt a reliable solution because the total count for each action type would change over time which means the colors would also change.
Ideally I would like to able to set a color for each action type, for example: Closed = green, Overdue = red, Started = Orange, Open = blue.
How can i achieve this, any ideas anyone please?