@moe @Chem
I need some help with some custom JS code.
I am implementing Apex charts, which is great.
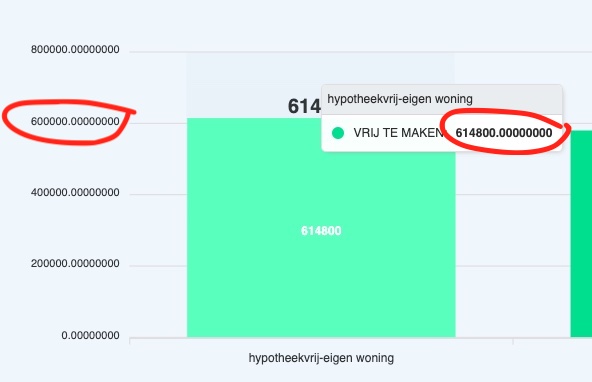
But the values from the columns are showed with more decimals then preferred.
How can I add the . as a thousand separator and remove the digits behind the comma? E.g. a 100.000 is shown as 100000,000000… These numbers behind the comma need to be removed and there needs to be a dot between 100 and the 0000… THis is the code which I now have:
var options = {
          series: [{
          name: 'HYPOTHEEK',
          data: ["{pageField.Hypotheek}", "{pageField.Hypotheek}", "{pageField.Hypotheek}"]

        }, {
          name: 'VRIJ TE MAKEN',
          data: ['{pageField.Xoutput_QSmaximaalmetmaandlast}','{pageField.Xoutput_QSmaximaalmetmaandlastbox3}','{pageField.Xoutput_QSsociomaximaal}','{pageField.Xoutput_QSmaximaallevius}']


        }],
          chart: {
          type: 'bar',
          height: 350,
          stacked: true,
          toolbar: {
            show: true
          },
          zoom: {
            enabled: true
          }
        },
        responsive: [{
          breakpoint: 480,
          options: {
            legend: {
              position: 'bottom',
              offsetX: -10,
              offsetY: 0
            }
          }
        }],
        plotOptions: {
          bar: {
            horizontal: false,
            borderRadius: 10,
            dataLabels: {
              total: {
                enabled: true,
                style: {
                  fontSize: '20px',
                  fontWeight: 900
                }
              }
            }
          },
        },
        xaxis: {
          categories:['{pageField.Xinput_naamaanbieder}-eigen woning','{pageField.Xinput_naamaanbieder} - vrije besteding','Overwaarde zonder maandlast', 'Verkoop en terughuur'
          ],
        },
        legend: {
          position: 'right',
          offsetY: 40,
          fontSize: '20px'
        },
        fill: {
          opacity: 1
        }
        };
        var chart = new ApexCharts(document.querySelector("#chart"), options);
        chart.render();

    var formatter = new Intl.NumberFormat('de-DE', {
      style: 'currency',
      currency: 'EUR',
      minimumFractionDigits: '0',
     maximumFractionDigits: '0',